


In this tutorial, we'll discuss the basics of Pandas Styling and DataFrame formatting. We will also check frequently asked questions for DataFrame styles and formats.
We'll start with basic usage, methods, parameters and then see a few Pandas styling examples. Next, we'll learn how to beautify DataFrame and communicate data more efficiently.
Additionally, we'll discuss tips and also learn some advanced techniques like cell or column highlighting.
Hope that you will learn invaluable tips for Pandas styling and formatting like:
and
Which one is better for the last image? Without formatting or with?
If you need to check formatting and styling for pivot tables in check this: Apply Formatting and Borders to Pivot table in Pandas
Setup
In this tutorial we will work with the Seaborn dataset for flights. Which can be loaded with method sns.load_dataset()
import seaborn as sns
import pandas as pd

df = sns.load_dataset('flights')
pd.pivot_table(df, index='year', columns='month')
We will convert the initial DataFrame to a pivot table. This will give us a better DataFrame for styling.
Initial Data looks like:
| year | month | passengers | |
|---|---|---|---|
| 0 | 1949 | Jan | 112 |
| 1 | 1949 | Feb | 118 |
| 2 | 1949 | Mar | 132 |
| 3 | 1949 | Apr | 129 |
| 4 | 1949 | May | 121 |
While the pivot table is - having all years like rows and all months as columns (below data is truncated):
| passengers | |||||||
|---|---|---|---|---|---|---|---|
| month | Jan | Feb | Mar | Apr | May | Jun | Jul |
| year | |||||||
| 1949 | 112 | 118 | 132 | 129 | 121 | 135 | 148 |
| 1950 | 115 | 126 | 141 | 135 | 125 | 149 | 170 |
| 1951 | 145 | 150 | 178 | 163 | 172 | 178 | 199 |
| 1952 | 171 | 180 | 193 | 181 | 183 | 218 | 230 |
1. How do I style a Pandas DataFrame?
To style a Pandas DataFrame we need to use .style and pass styling methods. This returns a Styler object and not a DataFrame.
We can control the styling by parameters and options.
We can find the most common methods and parameters for styling in Pandas in the next section.
The syntax for the Pandas Styling methods is:
df.style.highlight_null(null_color="blue")
1.1 Combine Pandas styling methods
Styling methods can be chained so we can replace NaN values and highlight them in red background at once:
df1.style.format(na_rep='').highlight_null(null_color="red")
Formatting of the last method in the chain takes action. NaN values with be highlighted in blue:
df1.style.highlight_null(null_color="red").highlight_null(null_color="blue")
1.2 Why using Pandas styling methods
Several reasons why to use Pandas styling methods:
- focus attention on the important data and trends
- style change only visual representation and not the data
- beauty attracts attention
- you will show better understanding of the subject - choosing correct styling is power data science skill
2. Pandas styling methods
Let's start with most popular Pandas methods for DataFrame styling like:
format(na_rep='', precision=2)- general formatting of DataFrame - missing values, decimal precisionbackground_gradient()- style DataFrame as heatmaphighlight_min()- highlight min values across rows or columnshighlight_max()- highlight max values across rows or columnsbar()- display column as barhighlight_null()- highlight missing values in DataFrameset_table_styles()- style the entire table, columns, rows or specific HTML selectors.set_table_attributes()- set the table attributes added to the<table>HTML elementset_properties()- Set defined CSS-properties to each<td>HTML element for the given subset
Some methods are still available by will be deprecated in future:
set_na_rep()- replace NaN values
- replaced by Styler.format(na_rep=..)
set1_precision()- set decimal precision
- replaced by Styler.format(precision=..)
hide_index()- hide the index
- Styler.hide(axis='index')
2.1 Pandas Styling Parameters
Popular parameters for Pandas styling:
axis- 0 - row wise
- 1 - column wise
- None - DataFrame wise
subset- column/row names on which the styling will be applied
cmap- the color scheme for the styling
- examples - summer, Greens, ocean
- to find more options - enter wrong value and get all options from the exception
vmin/vmax- the minimum and maximum value
2.2 Pandas Format DataFrame
To format the text display value of DataFrame cells we can use method: styler.format():
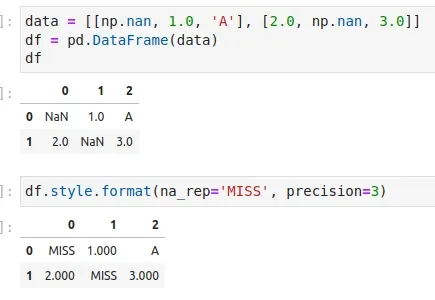
df.style.format(na_rep='MISS', precision=3)
Result is replacing missing values with string 'MISS' and set float precision to 3 decimal places:
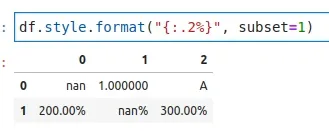
Another format example - add percentage to the numeric columns:
df.style.format("{:.2%}", subset=1)
Default values for this method:
styler.format.formatter: default None.styler.format.na_rep: default None.styler.format.precision: default 6.styler.format.decimal: default “.”.styler.format.thousands: default None.styler.format.escape: default None.
We can combine method format with lambda to format the columns:
.format({"col_1": lambda x:x.upper()})
This will convert the column col_1 to upper case.
2.3 DataFrame as heatmap
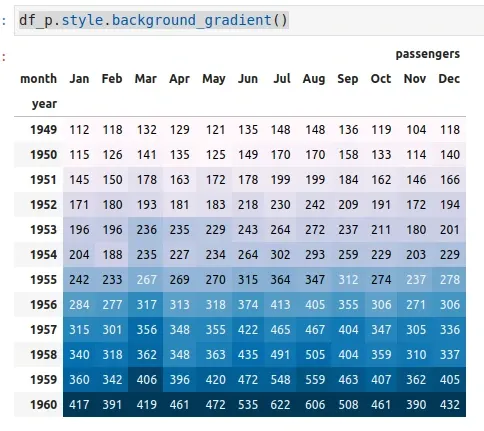
To convert Pandas DataFrame to a beautiful Heatmap we can use method .background_gradient():
df_p.style.background_gradient()
The result is colored DataFrame which show us that number of passengers grow with the increase of the years:
One more example using parameters vmin and vmax:
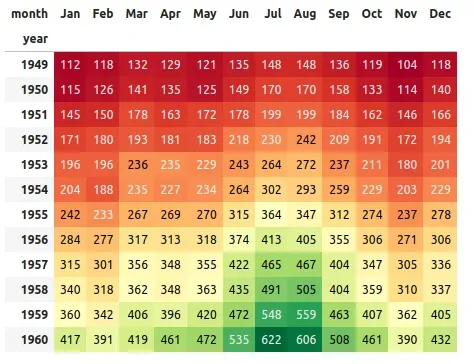
df_p.style.background_gradient(cmap = "RdYlGn", vmin = 104, vmax = 622)
which create descriptive visual table:
More example about: How to Display Pandas DataFrame As a Heatmap
2.4 DataFrame column as bar chart
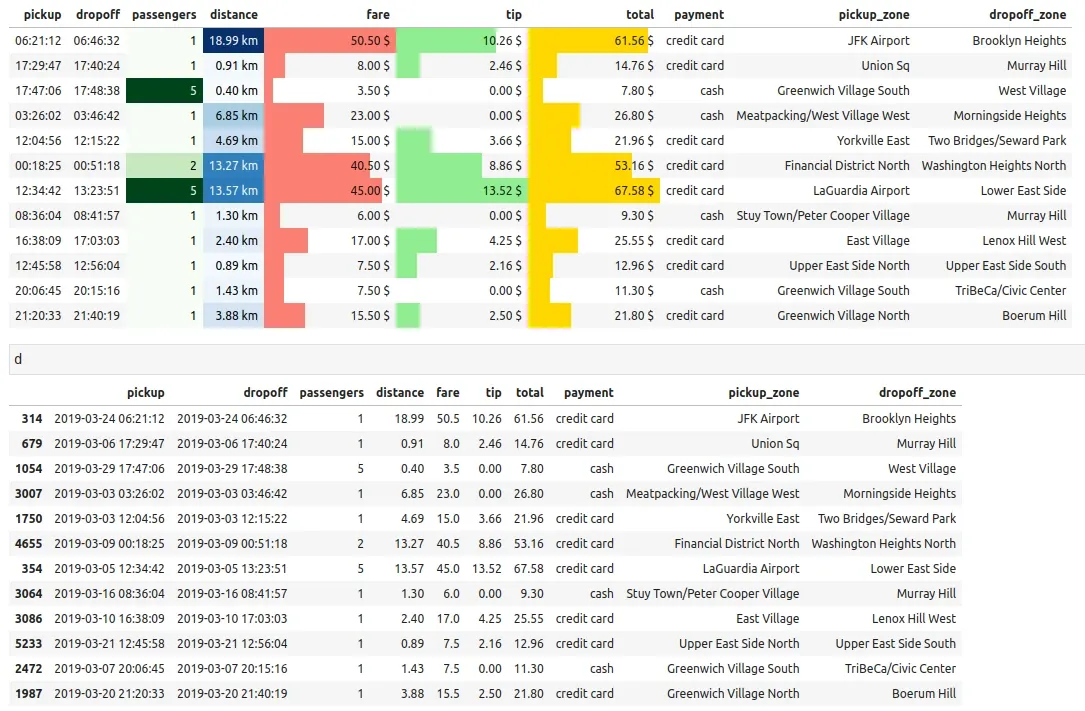
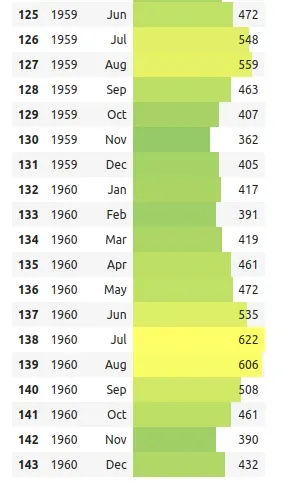
To convert Pandas column to bar visualization inside the DataFrame output we can use method bar:
df.head().style.bar(subset=['passengers'], cmap='summer')
We can see a clear pattern by using the bar styling. Passenger increase in the summer and decrease in the winter months:
2.5 Highlight max values
To highlight max values in Pandas DataFrame we can use the method: highlight_max().
By default highlights max values per column:
df_p.style.highlight_max()
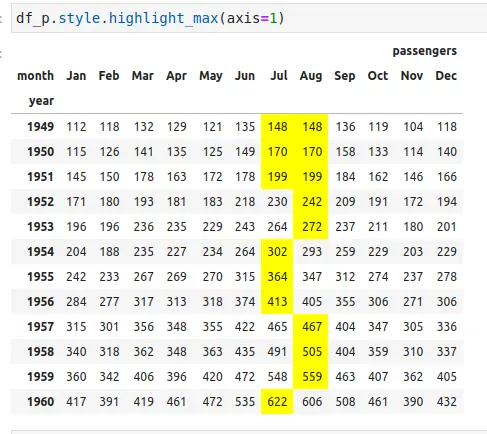
To highlight max values per row we need to pass - axis=1. In case of max value in more than one cell - all will be highlighted:
df_p.style.highlight_max(axis=1)
The max values are highlighted in yellow. Which makes easy to digest data:
2.6 Highlight min values
To highlight the min values we can use: highlight_min().
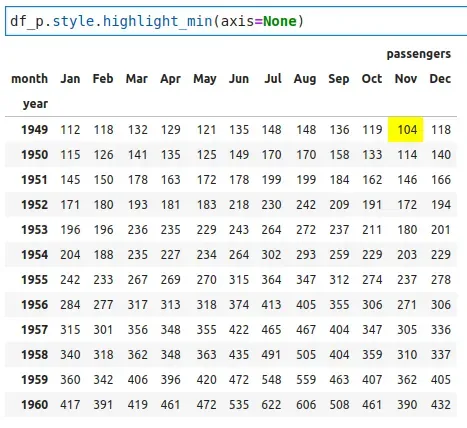
It's pretty similar to the max values from above. We can find the absolute minimum value by - axis=None:
df_p.style.highlight_min(axis=None)
This will focus the attention on the absolute min value:
2.7 Highlight NaN values in DataFrame
To highlight NaN values in a Pandas DataFrame we can use the method: .highlight_null().
Selecting the color for the NaN highlight is available with parameter - null_color="blue":
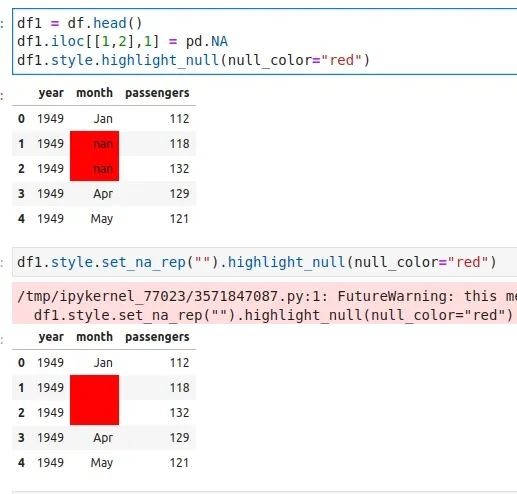
To prepare the NaN values we use:
df1 = df.head()
df1.iloc[[1,2],1] = pd.NA
and then we highlight them by:
df1.style.highlight_null(null_color="red")
2.8 Replace NaN values in Pandas styling
To replace NaN values with string in a Pandas styling we can use two methods:
.format(na_rep='').set_na_rep()- this one will be deprecated in future
Replacing NaN values in styling with empty spaces:
df1.style.format(na_rep='')
or:
df1.style.set_na_rep("")
Note: This method will soon be deprecated - so you can use: Styler.format(na_rep=..) to avoid future errors
2.9 Set title to DataFrame
To set title to Pandas DataFrame we can use method: set_caption()
df.style.set_caption("DataScientYst 2022")
Title is added to the DataFrame:

2.10 Set table styles in DataFrame
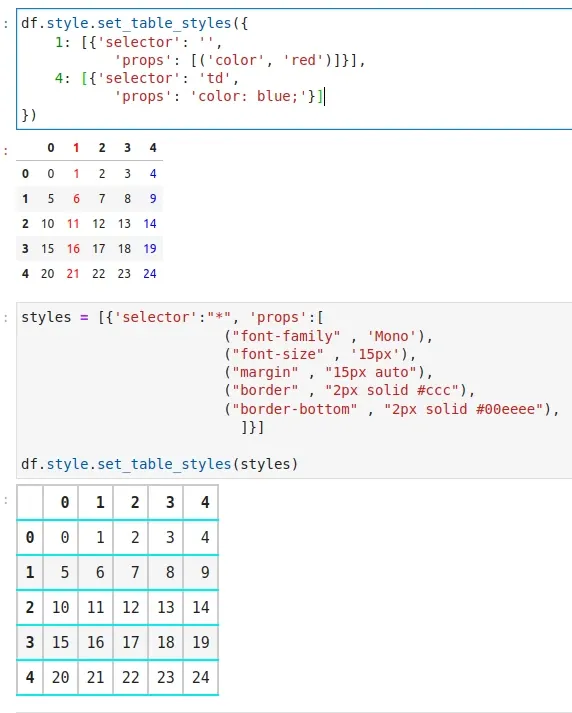
To set table styles and properties of Pandas DataFrame we can use method: set_table_styles()
To apply table styles only for specific columns we can select the columns by:
df.style.set_table_styles({
    1: [{'selector': '',
           'props': [('color', 'red')]}],
    4: [{'selector': 'td',
           'props': 'color: blue;'}]
})
Columns 1 and 4 are changed:
To apply new table style and properties we can use HTML selectors like:
*- select allth- headertr- rowtd- cell
styles = [{'selector':"*", 'props':[
                        ("font-family" , 'Mono'),
                        ("font-size" , '15px'),
                        ("margin" , "15px auto"),
                        ("border" , "2px solid #ccc"),
                        ("border-bottom" , "2px solid #00eeee")]}]

df.style.set_table_styles(styles)
the result from both examples:
3. Pandas apply format
To apply format on Pandas DataFrame we can use methods:
.apply().applymap()
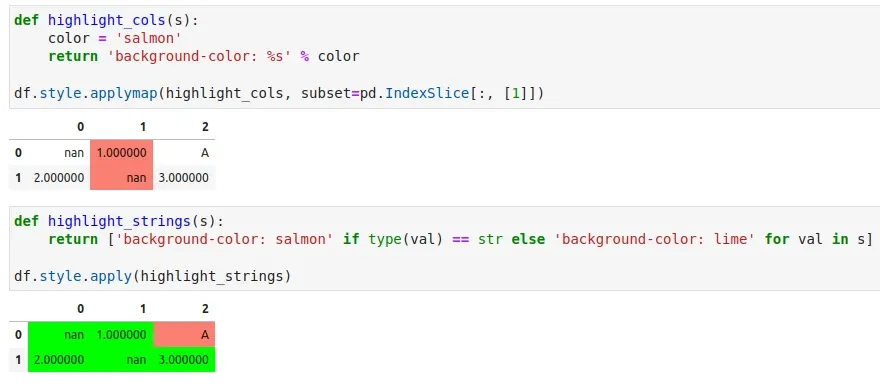
Example for applymap used to color column in red:
def highlight_cols(s):
    color = 'salmon'
    return 'background-color: %s' % color

df.style.applymap(highlight_cols, subset=pd.IndexSlice[:, [1]])
Use apply() to format string values:
def highlight_strings(s):
    return ['background-color: salmon' if type(val) == str else 'background-color: lime' for val in s]

df.style.apply(highlight_strings)
results are visible below:
4. Pandas styling examples & FAQ
4.1 How do I beautify a DataFrame in Python?
To beautify Pandas DataFrame we can combine different methods to create visual impact.
First let's create simple DataFrame from numbers from 0 to 24:
import numpy as np
import pandas as pd

a = np.arange(25).reshape(5,5)

df = pd.DataFrame(a)
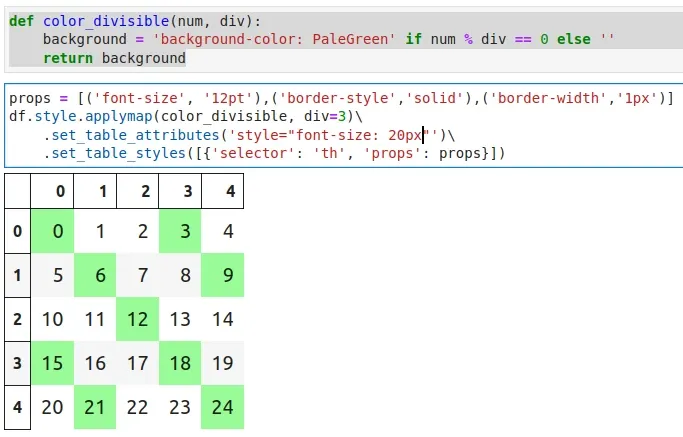
Next we will define the function color_divisible - and apply it on the DataFrame. Then we will change the table properties like - headers, rows etc:
def color_divisible(num, div):
    background = 'background-color: PaleGreen' if num % div == 0 else ''
    return background

props = [('font-size', '12pt'),('border-style','solid'),('border-width','1px')]
df.style.applymap(color_divisible, div=3)\
    .set_table_attributes('style="font-size: 20px"')\
    .set_table_styles([{'selector': 'th', 'props': props}])
The result is attached to the image.
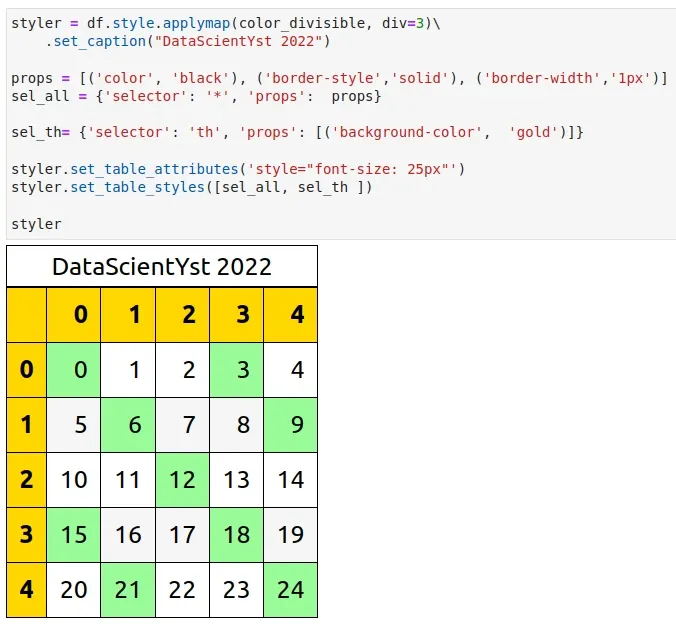
Second example on - how to beautify DataFrame. Coloring the table headers, values and changing border styles:
styler = df.style.applymap(color_divisible, div=3)\
    .set_caption("DataScientYst 2022")

props = [('color', 'black'), ('border-style','solid'), ('border-width','1px')]
sel_all = {'selector': '*', 'props':  props}

sel_th= {'selector': 'th', 'props': [('background-color',  'gold')]}

styler.set_table_attributes('style="font-size: 25px"')
styler.set_table_styles([sel_all, sel_th ])

styler
The beautified DataFrame is below:
4.2 How do you color a column in Pandas?
Depending on the results and data we can use different techniques to color Pandas columns.
We already saw(will see) how to color column:
- in a single color with applymap/apply
- as heatmap with
.background_gradient()and subset - as bar with
.bar(subset=['passengers'], cmap='summer')
4.3 How do I change the color of a DataFrame in Python?
Usually I prefer to change the color of DataFrame by using combination of:
- numeric values
.background_gradient()and subset.bar(subset=['passengers'], cmap='summer')
- highlight groups in Pandas
- Color boolean values in DataFrame
4.4 How do I highlight cells in Pandas?
For conditional formatting of DataFrame I prefer to use the built-in style functions.
If something is not covered as functionality - then I will use custom function with:
applyapplymap
to highlight cells like we saw:
highlight_colshighlight_strings
4.5 How to pretty print Pandas DataFrame
To pretty print Pandas DataFrame we can use the built in function .to_markdown():
print(df.to_markdown())
result:
| 0 | 1 | 2 | 3 | 4 | |
|---|---|---|---|---|---|
| 0 | 0 | 1 | 2 | 3 | 4 |
| 1 | 5 | 6 | 7 | 8 | 9 |
| 2 | 10 | 11 | 12 | 13 | 14 |
| 3 | 15 | 16 | 17 | 18 | 19 |
| 4 | 20 | 21 | 22 | 23 | 24 |
Or Python library tabulate:
from tabulate import tabulate
print(tabulate(df, headers='keys', tablefmt='simple'))
result:
      0    1    2    3    4
--  ---  ---  ---  ---  ---
 0    0    1    2    3    4
 1    5    6    7    8    9
 2   10   11   12   13   14
 3   15   16   17   18   19
 4   20   21   22   23   24
4.6 Render Pandas DataFrame as HTML
To render Pandas DataFrame as HTML we can use method - .to_html():
print(df.to_html())
Then we can use the HTML table code generated from the DataFrame:
<table border="1" class="dataframe">
  <thead>
    <tr style="text-align: right;">
      <th></th>
      <th>0</th>
      <th>1</th>
      <th>2</th>
      <th>3</th>
      <th>4</th>
    </tr>
  </thead>
  <tbody>
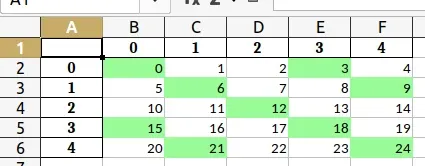
4.7 Export DataFrame format as Excel table
To export DataFrame as Excel table, keep styles and formatting we can use method: .to_excel('style.xlsx', engine='openpyxl'):
styler = df.style.applymap(color_divisible, div=3)
styler.to_excel('style.xlsx', engine='openpyxl')
The code above will create a Pandas style. Then we export the styles to a file named style.xlsx.
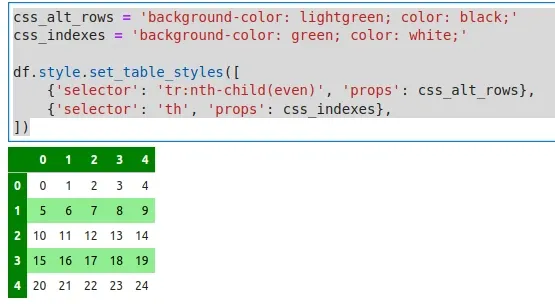
4.8 Format Pandas DataFrame as Excel table
Excel has pre-built table formats - altering color rows. To format DataFrame as Excel table we can do:
css_alt_rows = 'background-color: lightgreen; color: black;'
css_indexes = 'background-color: green; color: white;'

df.style.set_table_styles([
    {'selector': 'tr:nth-child(even)', 'props': css_alt_rows},
    {'selector': 'th', 'props': css_indexes},
])
Find the results - DataFrame styled as Excel table below:
5. Global Display Options in Pandas
To change Pandas display option we can use several methods like:
get_option()/set_option()- get/set the value of a single option.reset_option()- reset one or more options to their default value.describe_option()- print the descriptions of one or more options.option_context()- execute a codeblock with a set of options that revert to prior settings after execution.
import pandas as pd

pd.options.display.max_rows        # 15
pd.options.display.max_rows = 999
pd.set_option("display.max_rows", 999)
show more columns and rows(or show all columns and rows in Pandas:
with pd.option_context("display.max_rows", 1000, "display.max_columns", 50):
    print(pd.get_option("display.max_rows"))
    print(pd.get_option("display.max_columns"))
To find more for Pandas options we can refer to the official documentation: Pandas options and settings
6. Pandas Styling tips
Finally we will cover several tips for styling Pandas DataFrames:
- don't overdo it - use styles when needed. To many colors might distract the person who will digest the information
- control the styles with parameters like
subset- format subset of DataFrameaxis- rows or columns
- ask for feedback before sharing it on larger audience
- add titles, legends - anything which is required for correct understanding of the styles/data
- format columns based on the data
- amounts
- distance
- temperature
- dates
- select colors carefully
- research on other people work and share your work
Share your tips as comments below the article! Thank you!
References
- API reference - pandas.io.formats.style.Styler.format
- User Guide - Table Visualization — pandas 1.5.1 documentation - PyData
- User Guide - Styling — pandas 1.1.5 documentation
- Options and settings in Pandas
- display articles - DataScientyst
- Table articles - DataScientyst
- Styling articles - DataScientyst