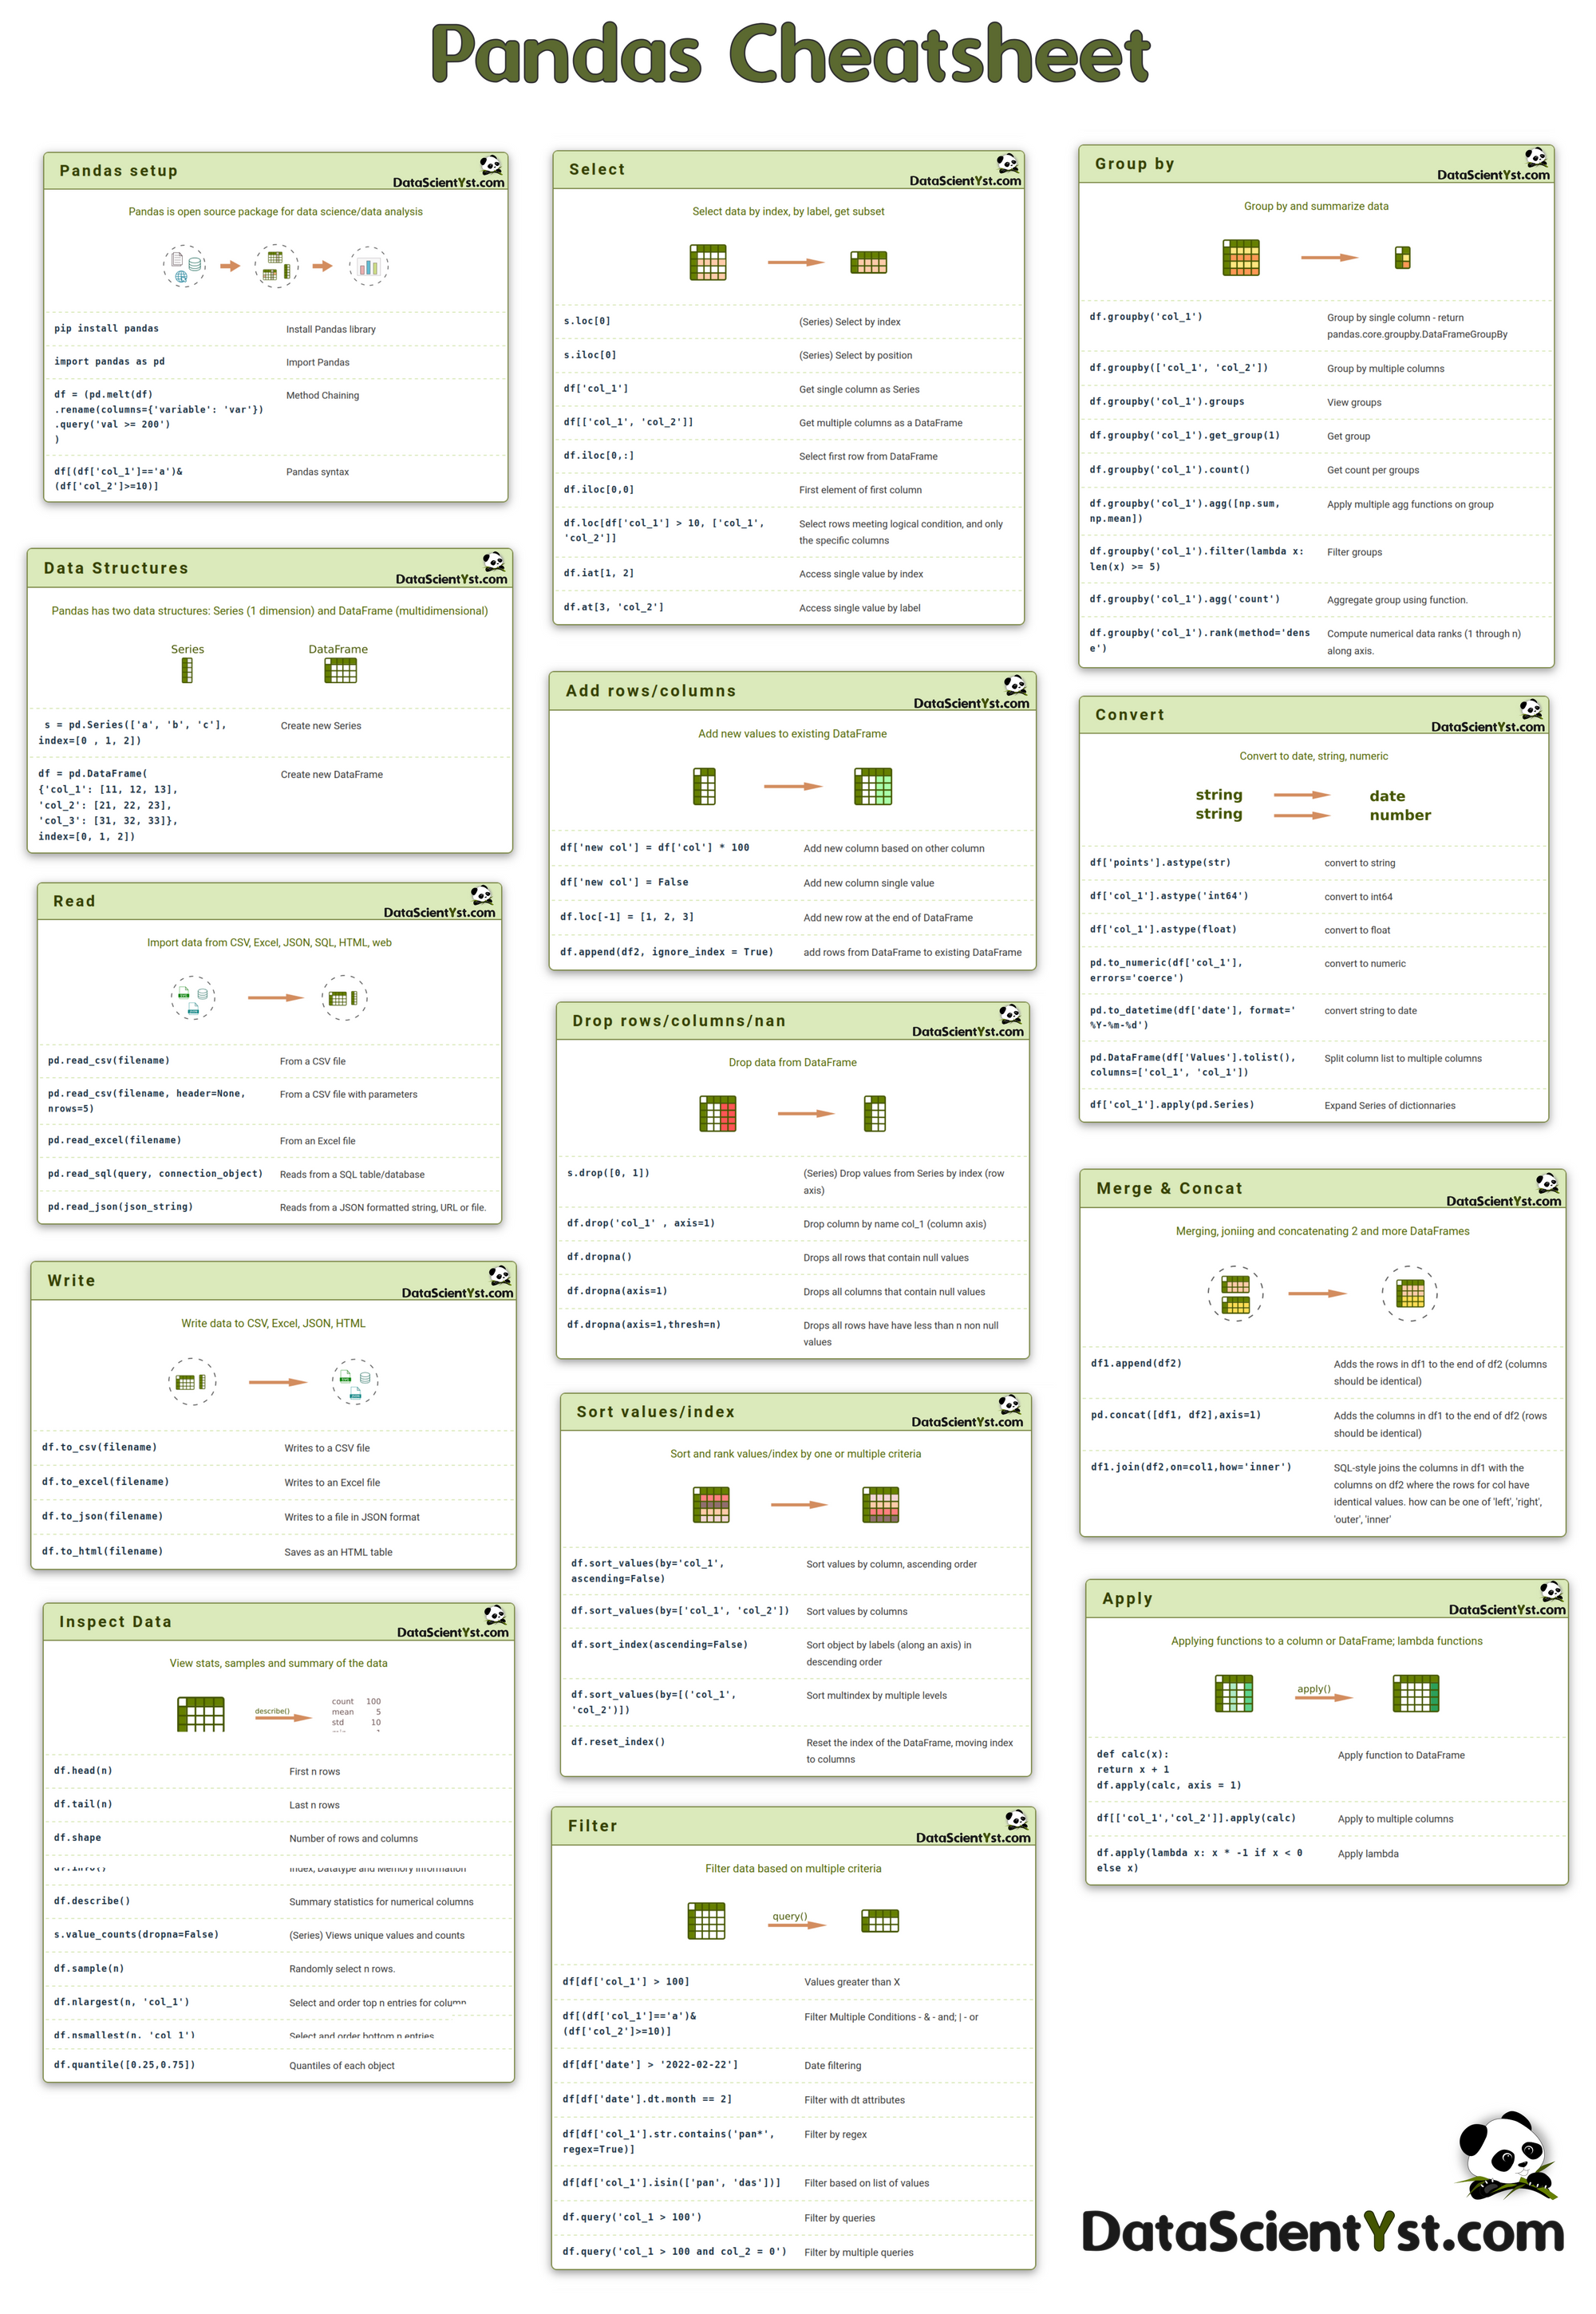
A handy Pandas Cheat Sheet useful for the aspiring data scientists and contains ready-to-use codes for data wrangling.
The cheat sheet summarize the most commonly used Pandas features and APIs.
This cheat sheet will act as a crash course for Pandas beginners and help you with various fundamentals of Data Science. It can be used by experienced users as a quick reference.
Pandas setup
Pandas is open source package for data science/data analysis

pip install pandasInstall Pandas library
import pandas as pdImport Pandas
df = (pd.melt(df)
      .rename(columns={'variable': 'var'})
      .query('val >= 200')
      )
Method Chaining
df[(df['col_1']=='a')&(df['col_2']>=10)]Pandas syntax
Data Structures
Pandas has two data structures: Series (1 dimension) and DataFrame (multidimensional)

s = pd.Series(['a', 'b', 'c'], index=[0 , 1, 2])Create new Series
df = pd.DataFrame(
    {'col_1': [11, 12, 13],
     'col_2': [21, 22, 23],
     'col_3': [31, 32, 33]},
    index=[0, 1, 2])
Create new DataFrame
Read
Import data from CSV, Excel, JSON, SQL, HTML, web

pd.read_csv(filename)From a CSV file
pd.read_csv(filename, header=None, nrows=5)From a CSV file with parameters
pd.read_excel(filename)From an Excel file
pd.read_sql(query, connection_object)Reads from a SQL table/database
pd.read_json(json_string)Reads from a JSON formatted string, URL or file.
Write
Write data to CSV, Excel, JSON, HTML

df.to_csv(filename)Writes to a CSV file
df.to_excel(filename)Writes to an Excel file
df.to_json(filename)Writes to a file in JSON format
df.to_html(filename)Saves as an HTML table
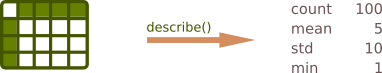
Inspect Data
View stats, samples and summary of the data
df.head(n)First n rows
df.tail(n)Last n rows
df.shapeNumber of rows and columns
df.info()Index, Datatype and Memory information
df.describe()Summary statistics for numerical columns
s.value_counts(dropna=False)(Series) Views unique values and counts
df.sample(n)Randomly select n rows.
df.nlargest(n, 'col_1')Select and order top n entries for column
df.nsmallest(n, 'col_1')Select and order bottom n entries.
df.quantile([0.25,0.75])Quantiles of each object
Select
Select data by index, by label, get subset

s.loc[0](Series) Select by index
s.iloc[0](Series) Select by position
df['col_1']Get single column as Series
df[['col_1', 'col_2']]Get multiple columns as a DataFrame
df.iloc[0,:]Select first row from DataFrame
df.iloc[0,0]First element of first column
df.loc[df['col_1'] > 10, ['col_1', 'col_2']]Select rows meeting logical condition, and only the specific columns
df.iat[1, 2] Access single value by index
df.at[3, 'col_2'] Access single value by label
Add rows/columns
Add new values to existing DataFrame

df['new col'] = df['col'] * 100Add new column based on other column
df['new col'] = FalseAdd new column single value
df.loc[-1] = [1, 2, 3]Add new row at the end of DataFrame
df.append(df2, ignore_index = True)add rows from DataFrame to existing DataFrame
Drop rows/columns/nan
Drop data from DataFrame

s.drop([0, 1])(Series) Drop values from Series by index (row axis)
df.drop('col_1' , axis=1) Drop column by name col_1 (column axis)
df.dropna()Drops all rows that contain null values
df.dropna(axis=1)Drops all columns that contain null values
df.dropna(axis=1,thresh=n)Drops all rows have have less than n non null values
Sort values/index
Sort and rank values/index by one or multiple criteria

df.sort_values(by='col_1', ascending=False)Sort values by column, ascending order
df.sort_values(by=['col_1', 'col_2'])Sort values by columns
df.sort_index(ascending=False)Sort object by labels (along an axis) in descending order
df.sort_values(by=[('col_1', 'col_2')])Sort multindex by multiple levels
df.reset_index()Reset the index of the DataFrame, moving index to columns
Filter
Filter data based on multiple criteria

df[df['col_1'] > 100]Values greater than X
df[(df['col_1']=='a')&(df['col_2']>=10)]Filter Multiple Conditions - & - and; | - or
df[df['date'] > '2022-02-22']Date filtering
df[df['date'].dt.month == 2]Filter with dt attributes
df[df['col_1'].str.contains('pan*', regex=True)]Filter by regex
df[df['col_1'].isin(['pan', 'das'])]Filter based on list of values
df.query('col_1 > 100')Filter by queries
df.query('col_1 > 100 and col_2 = 0')Filter by multiple queries
Group by
Group by and summarize data

df.groupby('col_1')Group by single column - return pandas.core.groupby.DataFrameGroupBy
df.groupby(['col_1', 'col_2'])Group by multiple columns
df.groupby('col_1').groupsView groups
df.groupby('col_1').get_group(1)Get group
df.groupby('col_1').count()Get count per groups
df.groupby('col_1').agg([np.sum, np.mean])Apply multiple agg functions on group
df.groupby('col_1').filter(lambda x: len(x) >= 5)Filter groups
df.groupby('col_1').agg('count')Aggregate group using function.
df.groupby('col_1').rank(method='dense')Compute numerical data ranks (1 through n) along axis.
Convert
Convert to date, string, numeric

df['points'].astype(str)convert to string
df['col_1'].astype('int64')convert to int64
df['col_1'].astype(float)convert to float
pd.to_numeric(df['col_1'], errors='coerce')convert to numeric
pd.to_datetime(df['date'], format='%Y-%m-%d')convert string to date
pd.DataFrame(df['Values'].tolist(), columns=['col_1', 'col_1'])Split column list to multiple columns
df['col_1'].apply(pd.Series)Expand Series of dictionnaries
Merge & Concat
Merging, joniing and concatenating 2 and more DataFrames

df1.append(df2)Adds the rows in df1 to the end of df2 (columns should be identical)
pd.concat([df1, df2],axis=1)Adds the columns in df1 to the end of df2 (rows should be identical)
df1.join(df2,on=col1,how='inner')SQL-style joins the columns in df1 with the columns on df2 where the rows for col have identical values. how can be one of 'left', 'right', 'outer', 'inner'
Apply
Applying functions to a column or DataFrame; lambda functions

def calc(x):
    return x + 1

df.apply(calc, axis = 1)
Apply function to DataFrame
df[['col_1','col_2']].apply(calc)Apply to multiple columns
df.apply(lambda x: x * -1 if x < 0 else x)Apply lambda