


This article shows how to scrape, analyze and visualize movie data from IMDb. We will learn how to use Python and Pandas in order to collect, transform and present data in a beautiful way.
Objective
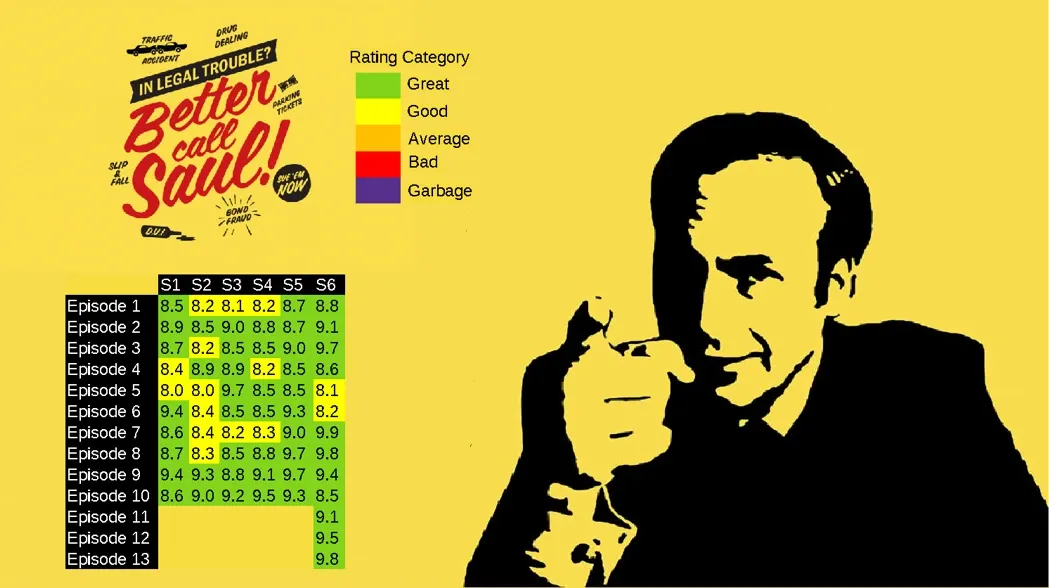
The second goal is to follow all steps in order to create popular DataIsBeautiful visualization:
So we will try to create similar artwork as the one posted on Reddit:
You can find notebook for this article:
![]()
And the game plan:
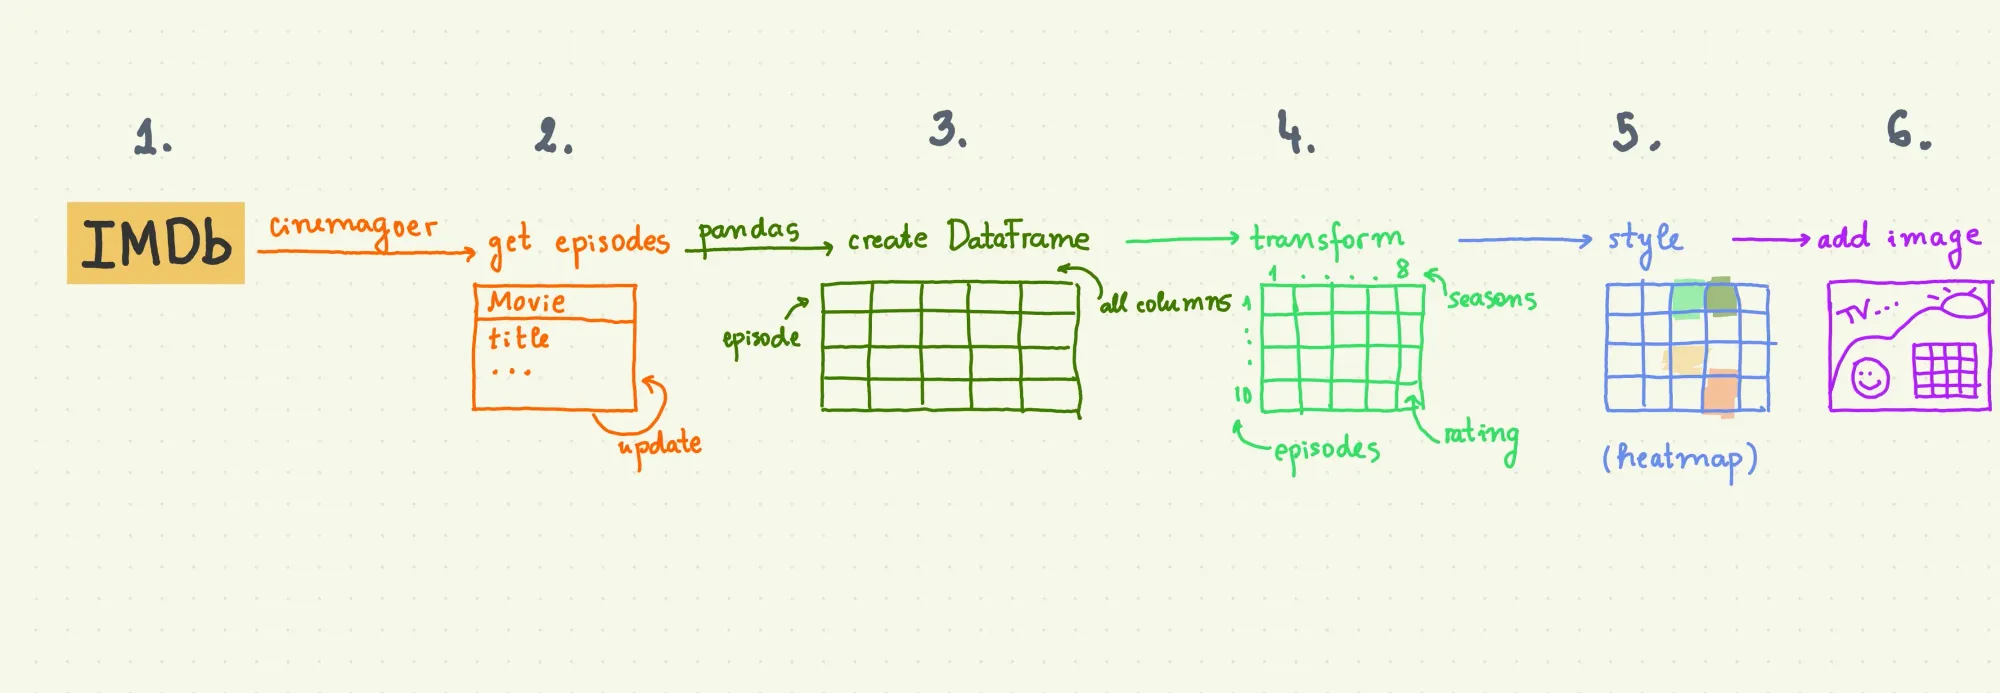
Step 1: Install Required Modules
In this tutorial we need 2 libraries:
import pandas as pd
from imdb import Cinemagoer
The library Cinemagoer can be installed by pip:
pip install cinemagoer
Cinemagoer (ex IMDbPY) is a Python package for retrieving the data of the IMDb movie database about movies, people and companies.
You can read more for this package here: cinemagoer.readthedocs
Step 2: Scrape IMDb Movie Data
Usually scraping or data collection is a tedious and hard process. Using Python libraries like Cinemagoer can make our life much easier.
So with a few lines of code we can extract well structured movie data from IMDb.
In this step you can find how to easily search and extract movie data from IMDb.
Get IMDb movie info
Let's start by collecting information about movies by using the IMDb identifier. So for the Game of Thrones - https://www.imdb.com/title/tt3728462/ we get id - 3728462.
To extract director name we can use following code:
from imdb import Cinemagoer

# create an instance of the Cinemagoer class
ia = Cinemagoer()

# get a movie and print its director(s)
the_matrix = ia.get_movie('3728462')
for director in the_matrix['directors']:
    print(director['name'])
which returns:
Michael Dixon
Search for movies
To search for IMDb movies using python we can use method: search_movie() and provide movie title:
# search for movie
movies = ia.search_movie('Game of Thrones')
movies
the result is list of movies found from IMDb:
[<Movie id:0944947[http] title:_"Game of Thrones" (2011)_>,
 <Movie id:13380510[http] title:_Game of Thrones (2003) (V)_>,
 <Movie id:2231444[http] title:_Game of Thrones (2012) (VG)_>,
 <Movie id:11198330[http] title:_"House of the Dragon" (2022)_>,
 <Movie id:10090796[http] title:_Game of Thrones: The Last Watch (2019) (TV)_>,...
Extract IMDb series
In this step we will extract series and episodes for a given movie:
[<Movie id:0944947[http] title:_"Game of Thrones" (2011)_>,
by using the ID of the movie from the previous step:
series = ia.get_movie('0944947')

ia.update(series, 'episodes')
sorted(series['episodes'].keys())
Collect episode data
Finally we will collect episodes and their data:
- rating
- votes
- year
- plot
import pandas as pd
from pandas import json_normalize

ep_data = []

ls = series.get('episodes')
for l in ls.values():
    for i in l.values():
#         print(i.movieID, '-',i.get('rating'), '-', i, )
        data = i.data
        if 'episode of' in data.keys():
            data.pop('episode of')
        df_temp = pd.DataFrame.from_records([data])
        ep_data.append(df_temp)

df = pd.concat(ep_data)
df
The result is DataFrame with data for all episodes from Game of Thrones:
| title | kind | season | episode | rating | votes | original air date | |
|---|---|---|---|---|---|---|---|
| 0 | Winter Is Coming | episode | 1 | 1 | 8.901235 | 49519 | 17 Apr. 2011 |
| 0 | The Kingsroad | episode | 1 | 2 | 8.601235 | 37465 | 24 Apr. 2011 |
| 0 | Lord Snow | episode | 1 | 3 | 8.501235 | 35445 | 1 May 2011 |
| 0 | Cripples, Bastards, and Broken Things | episode | 1 | 4 | 8.601235 | 33707 | 8 May 2011 |
| 0 | The Wolf and the Lion | episode | 1 | 5 | 9.001235 | 35046 | 15 May 2011 |
Step 3: Data Processing & Cleaning
In this step we would like to transform the original DataFrame data to Season vs Episode data.
For this purpose we will use pandas method pd.pivot_table():
pd.pivot_table(df, index='episode', columns='season', values='rating').round(1).fillna('').astype(str)
the result is table of episodes vs seasons information:
| season | 1 | 2 | 3 | 4 | 5 | 6 | 7 | 8 |
|---|---|---|---|---|---|---|---|---|
| episode | ||||||||
| 1 | 8.9 | 8.6 | 8.6 | 9.0 | 8.3 | 8.4 | 8.5 | 7.6 |
| 2 | 8.6 | 8.4 | 8.5 | 9.7 | 8.4 | 9.3 | 8.8 | 7.9 |
| 3 | 8.5 | 8.7 | 8.7 | 8.7 | 8.4 | 8.6 | 9.1 | 7.5 |
| 4 | 8.6 | 8.6 | 9.5 | 8.7 | 8.5 | 9.0 | 9.7 | 5.5 |
| 5 | 9.0 | 8.6 | 8.9 | 8.6 | 8.5 | 9.7 | 8.7 | 6.0 |
| 6 | 9.1 | 8.9 | 8.7 | 9.7 | 7.9 | 8.3 | 9.0 | 4.0 |
| 7 | 9.1 | 8.8 | 8.6 | 9.0 | 8.8 | 8.5 | 9.4 | |
| 8 | 8.9 | 8.6 | 8.9 | 9.7 | 9.8 | 8.3 | ||
| 9 | 9.6 | 9.6 | 9.9 | 9.6 | 9.4 | 9.9 | ||
| 10 | 9.4 | 9.3 | 9.0 | 9.6 | 9.1 | 9.9 |
How the code above work:
- we select the main parts of the
pivot_table:index='episode'columns='season'values='rating'
- next we round up to 1 decimal point
- replace NaN values by empty string
If you like to rename the column and index names we can use the following code:
df_p = pd.pivot_table(df, index='episode', columns='season', values='rating')

df_p = df_p.rename_axis('e')
df_p = df_p.rename_axis('s', axis=1)

df_p.style.background_gradient(cmap='GnBu', axis=None).format( precision=1, na_rep='')
Step 4: Visualize IMDb Data in Python
To make a beautiful heatmap from the IMDb data we can use Pandas Stylers - .style.background_gradient().
pd.pivot_table(df, index='episode', columns='season', values='rating').style.background_gradient(cmap='GnBu', axis=None).format( precision=1, na_rep='')
So this will produce heatmap from the series ratings:
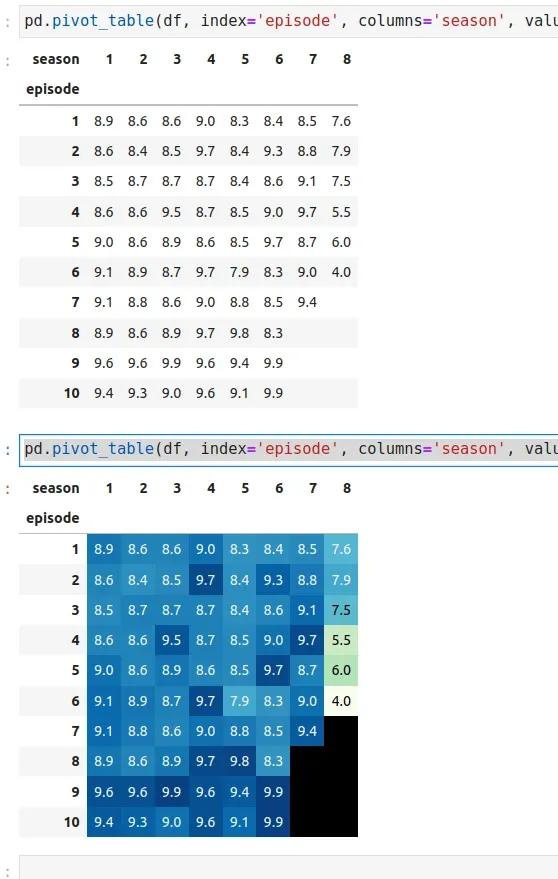
To make it work we use:
axis=None- in order to apply the heat map over the whole DataFrame- we can apply it to rows - 0 or columns - 1
cmap='GnBu'- selecting the color styles. To view different options you can provide wrong value and check the error message -cmap='xxx'precision=1- control decimal points for the float numbersna_rep=''- replace missing values by empty spaces
Step 5: Create Final Visualization
Finally we can do artwork by getting free images from: pixabay - golden dragon.
I'm using Inkscape to create the final image:
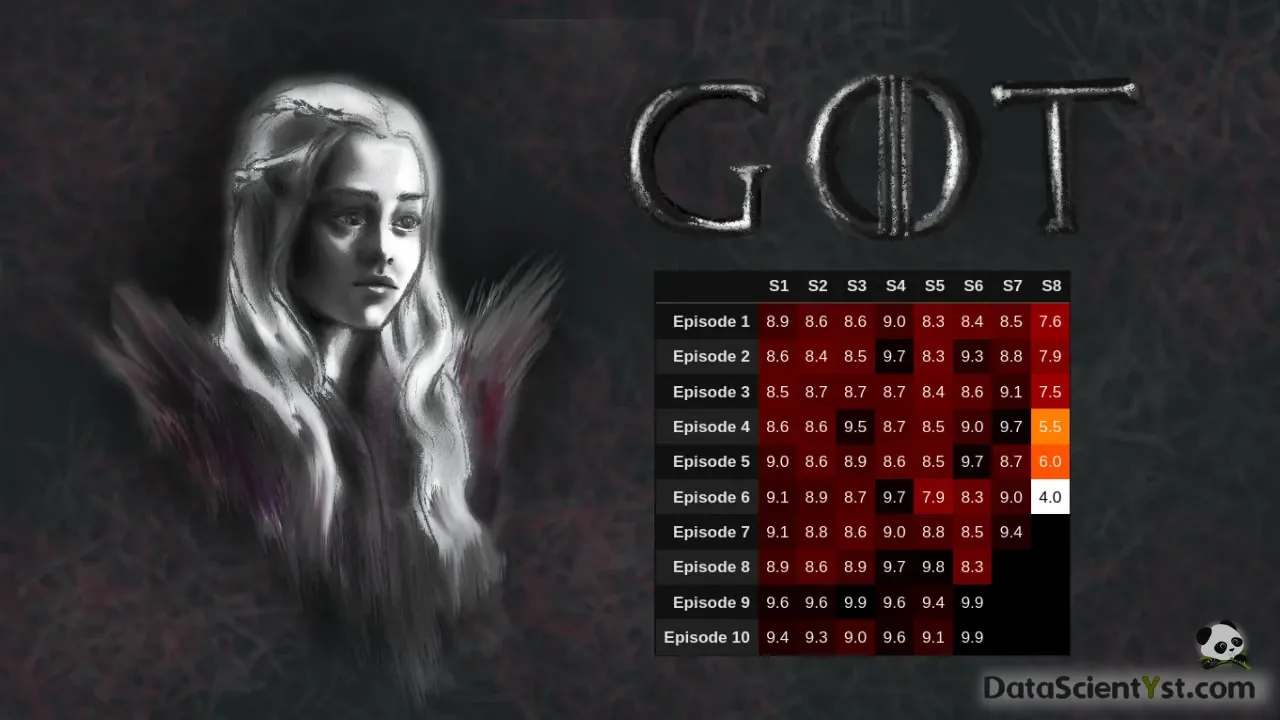
and one more:

Conclusion
In this article, we saw how to scrape and transform IMDb data in order to produce popular visualization.
We covered different Python libraries and techniques for data collection, wrangling and presenting data.
A video with all steps will be published on the Youtube channel. Next we will cover how to create a more popular visualization.
If you have ideas for other visualizations from DataIsBeautiful or other places - please suggest them.
Happy visualizing!