


Using Pandas, we usually have many ways to group and sort values based on condition.
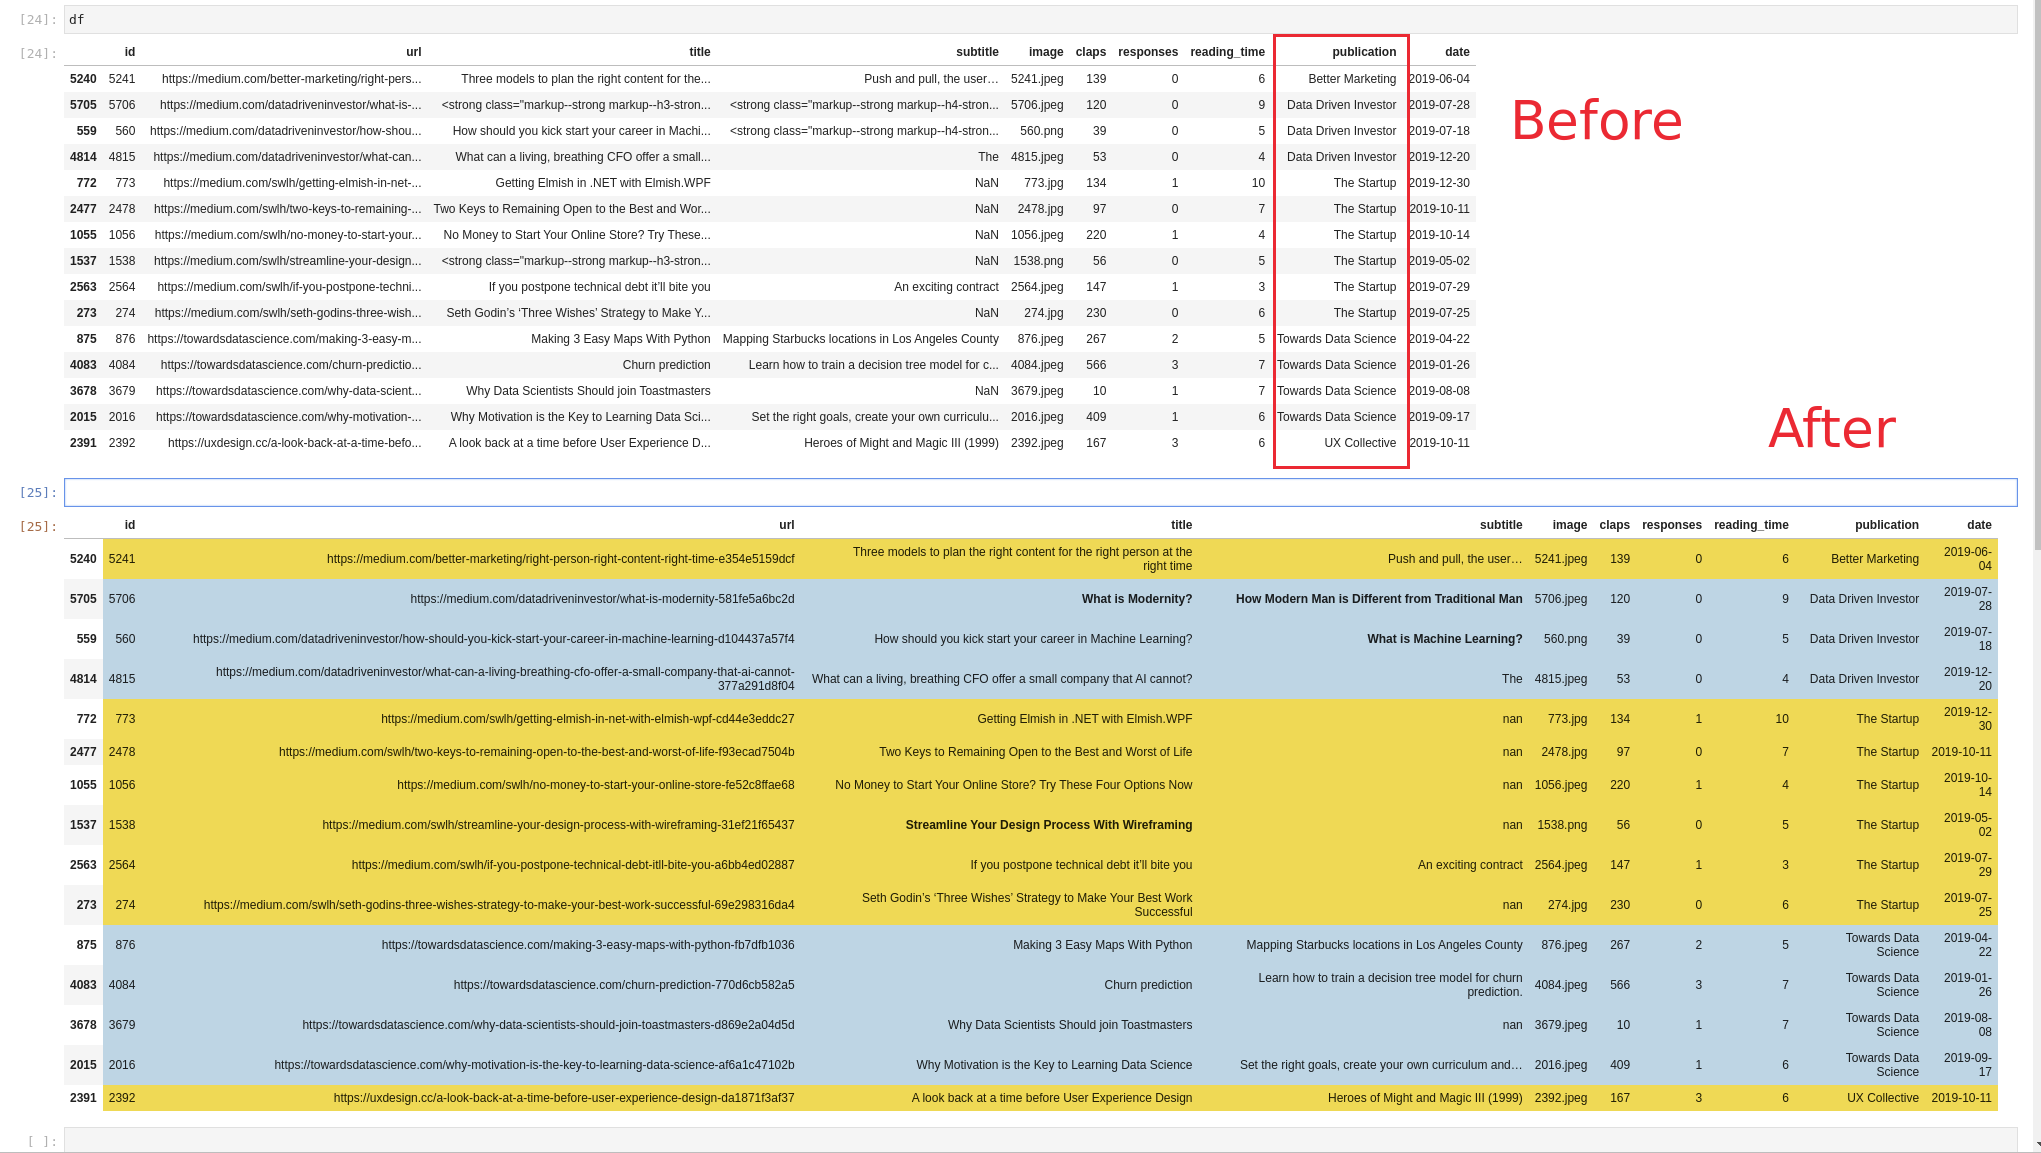
In this short tutorial, we'll see how to set the background color of rows based on cell values from the cell row. In other words we are going to use a column on which to group and then apply styling as shown below:
Whole code:
def format_color_groups(df):
    colors = ['gold', 'lightblue']
    x = df.copy()
    factors = list(x['publication'].unique())
    i = 0
    for factor in factors:
        style = f'background-color: {colors[i]}'
        x.loc[x['publication'] == factor, :] = style
        i = not i
    return x

df.style.apply(format_color_groups, axis=None)
Step 1: Read the data from Kaggle
In this example we are going to use data from Kaggle. If you like to learn more please refer to: How to Search and Download Kaggle Dataset to Pandas DataFrame
import pandas as pd
df = pd.read_csv('./data/medium_data.csv.zip').sample(15).sort_values(by='publication')
So we are getting 15 random records sorted by column 'publication'
Step 2: Build styling method for alternate coloring
In this step we are going to define a method which is going to change the background of the DataFrame based on value(s) from a given row.
def format_color_groups(df):
    colors = ['gold', 'lightblue']
    x = df.copy()
    factors = list(x['publication'].unique())
    i = 0
    for factor in factors:
        style = f'background-color: {colors[i]}'
        x.loc[x['publication'] == factor, :] = style
        i = not i
    return x
We are going to use two colors:
- 'gold'
- 'lightblue'
Then we select all unique values for the grouping column:
factors = list(x['publication'].unique())
Finally we iterate over the rows of the DataFrame and alternate the color for each group:
for factor in factors:
    style = f'background-color: {colors[i]}'
    x.loc[x['publication'] == factor, :] = style
    i = not i
New DataFrame with styles is built and returned.
Step 3: Apply Alternate Row Color based on Group
Finally we apply the styling on the whole DataFrame:
df.style.apply(format_color_groups, axis=None)
We will achive the next result:
