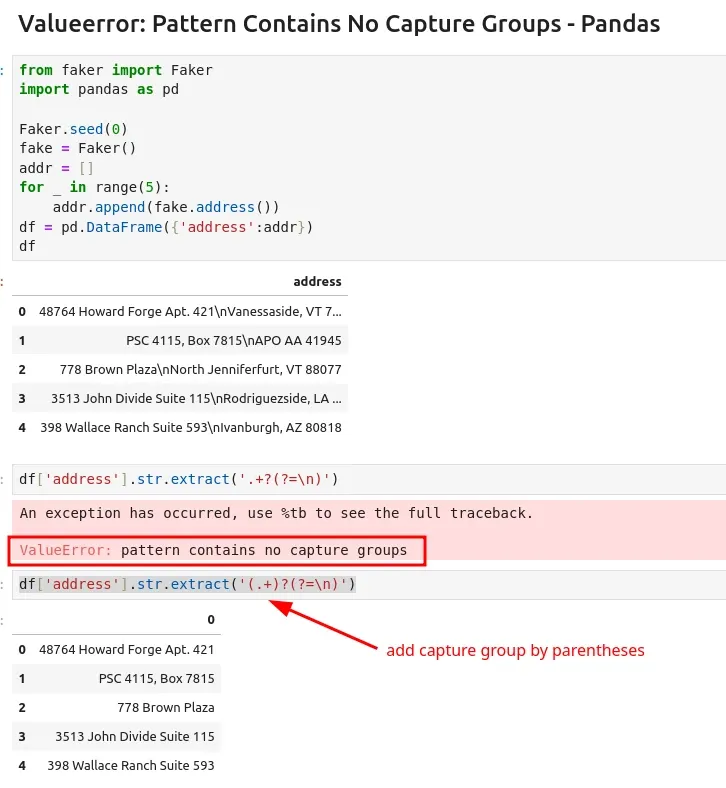
To solve Pandas Error: Valueerror: Pattern Contains No Capture Groups we need to specify a capture group.
Steps to plot 2 variables
- Import matplotlib library
- Create DataFrame with correlated data
- Create the figure and axes object -
fig, ax = plt.subplots() - Plot the first variable on x and left y axes
- Plot the second variable on x and secondary y axes
More information can be found: DataFrame.plot - secondary_y
Data
Let's have this DataFrame which will be used to demonstrate the error:
Valueerror: Pattern Contains No Capture Groups
from faker import Faker
import pandas as pd

Faker.seed(0)
fake = Faker()
addr = []
for _ in range(5):
	addr.append(fake.address())
df = pd.DataFrame({'address':addr})
df
| address | |
|---|---|
| 0 | 48764 Howard Forge Apt. 421\nVanessaside, VT 79393 |
| 1 | PSC 4115, Box 7815\nAPO AA 41945 |
| 2 | 778 Brown Plaza\nNorth Jenniferfurt, VT 88077 |
| 3 | 3513 John Divide Suite 115\nRodriguezside, LA 93111 |
| 4 | 398 Wallace Ranch Suite 593\nIvanburgh, AZ 80818 |
Example
The code below produce the error:
df['address'].str.extract('.+?(?=\n)')
to solve the error we will add parentheses to denote the capture group:
df['address'].str.extract('(.+)?(?=\n)')
So the fix is:
'.+?(?=\n)''(.+)?(?=\n)'
which produce:
| 0 | |
|---|---|
| 0 | 48764 Howard Forge Apt. 421 |
| 1 | PSC 4115, Box 7815 |
| 2 | 778 Brown Plaza |
| 3 | 3513 John Divide Suite 115 |
| 4 | 398 Wallace Ranch Suite 593 |
Output