


We can use the following syntax to create a pivot table in Python using Pandas:
df_pivot = df.pivot_table(values='D', index=['A', 'B'], columns='C')
Next, we'll see the full steps to create pivot tables in Pandas using a simple example.
Steps to create pivot table:
Step 1: Get data for pivot
Suppose we have the following DataFrame which contains 4 columns:
- 3 string columns
- 2 numeric
We will pivot on multiple columns in next sections
import pandas as pd

data = {"A": ["foo", "foo", "foo", "foo", "foo",
          	"bar", "bar", "bar", "bar"],
    	"B": ["one", "one", "one", "two", "two",
          	"one", "one", "two", "two"],
    	"C": ["small", "large", "large", "small",
          	"small", "large", "small", "small",
          	"large"],
    	"D": [1, 2, 2, 3, 3, 4, 5, 6, 7],
    	"E": [2, 4, 5, 5, 6, 6, 8, 9, 9]}

df = pd.DataFrame(data)
Let's see how to pivot based on data below:
| A | B | C | D | E | |
|---|---|---|---|---|---|
| 0 | foo | one | small | 1 | 2 |
| 1 | foo | one | large | 2 | 4 |
| 2 | foo | one | large | 2 | 5 |
| 3 | foo | two | small | 3 | 5 |
| 4 | foo | two | small | 3 | 6 |
| 5 | bar | one | large | 4 | 6 |
| 6 | bar | one | small | 5 | 8 |
| 7 | bar | two | small | 6 | 9 |
| 8 | bar | two | large | 7 | 9 |
Step 2: Select columns indexes and values
Next, determine the:
index- keys to group by on the pivot table indexcolumns- keys to group by on the pivot table columnvalues- columns used for aggregation data of the pivot tableaggfunc- functions or list of functions used for aggregation
We will demonstrate a pivot table using all of the above.
Step 3: Create the pivot table
Finally, create the pivot table using method: pivot_table() based on the following syntax:
pd.pivot_table(data, values=None, index=None, columns=None, aggfunc='mean')
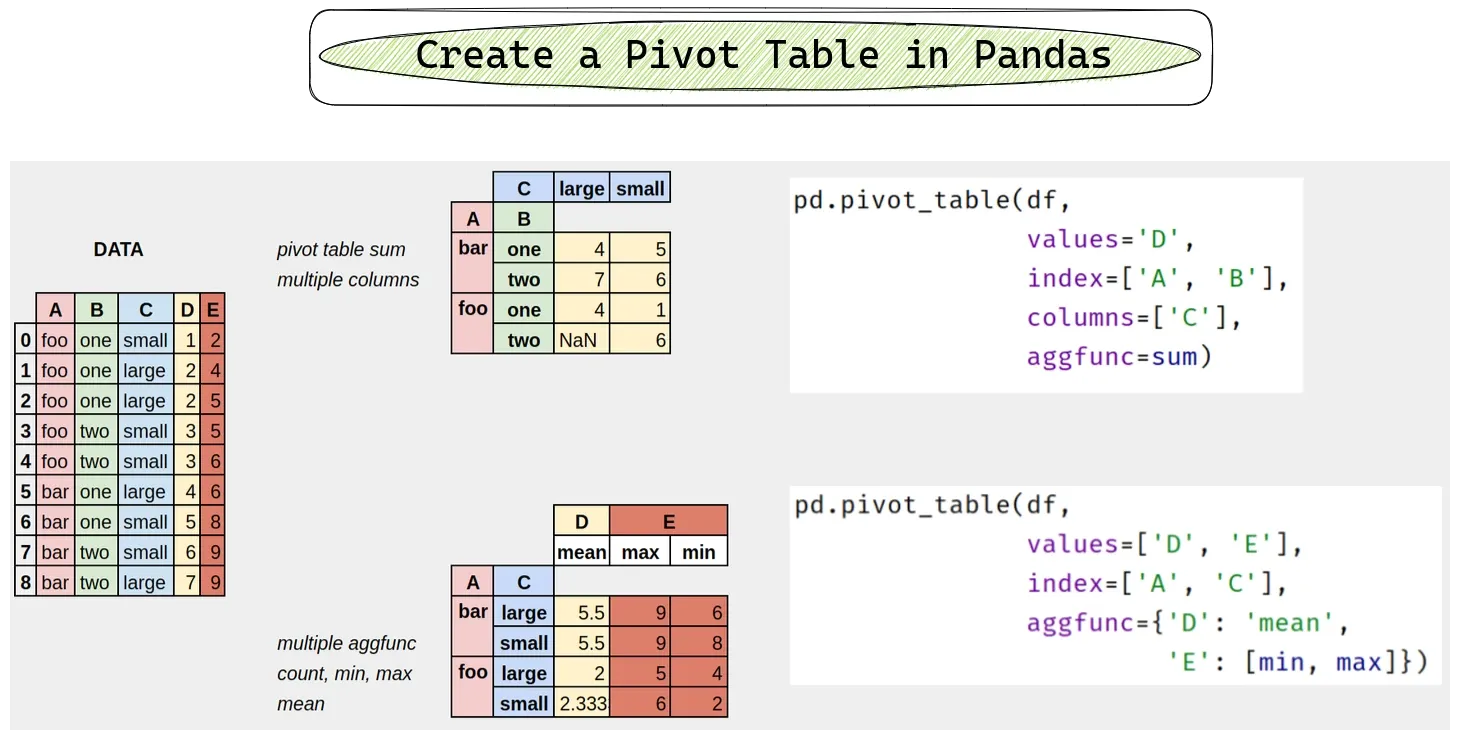
In our example we will create pivot table:
- using column 'D' as aggregating values
- for index we will have 2 columns - 'A' and 'B'
- this creates multi-index
- for columns we will use column 'C'
- as aggregating function we will use Python method
sum
df_pivot = pd.pivot_table(df, values='D', index=['A', 'B'],
                      	columns=['C'], aggfunc=sum)
df_pivot
The pivot table looks like:
| C | large | small | |
|---|---|---|---|
| A | B | ||
| bar | one | 4.0 | 5.0 |
| two | 7.0 | 6.0 | |
| foo | one | 4.0 | 1.0 |
| two | NaN | 6.0 |
Step 4: Advanced Pivot options
In the previous example we saw the basic usage of the pivot_table() method with most used options.
Alternatively, we may use more options with the following default values:
pd.pivot_table(data, values=None, index=None, columns=None, aggfunc='mean', fill_value=None,
               margins=False, dropna=True, margins_name='All', observed=False, sort=True)
Useful pivot options are:
fill_value- value to replace missing values withdropna- exclude columns whose entries are all NaNmargins- add all row/columns (subtotal / grand totals)sort- sort the results
Pivot table examples
Pivot Table with Multiple aggfunc
We can use multiple aggregation functions. The functions might be different for different columns:
- 'D' -
mean - 'E' -
minandmax
df_pivot = pd.pivot_table(df, values=['D', 'E'], index=['A', 'C'],
                      	aggfunc={'D': 'mean',
                               	'E': [min, max]})
df_pivot
Result:
| D | E | |||
|---|---|---|---|---|
| mean | max | min | ||
| A | C | |||
| bar | large | 5.500000 | 9 | 6 |
| small | 5.500000 | 9 | 8 | |
| foo | large | 2.000000 | 5 | 4 |
| small | 2.333333 | 6 | 2 | |
Pivot table replace NaN
To replace NaN values in the pivot table we can use the parameter fill_value. We can replace NaN values with 0 by:
df_pivot = pd.pivot_table(df, values='D', index=['A', 'B'],
                	columns=['C'], aggfunc=sum, fill_value=0)
df_pivot
Result of replace NaN values by 0 in pivot table:
| C | large | small | |
|---|---|---|---|
| A | B | ||
| bar | one | 4 | 5 |
| two | 7 | 6 | |
| foo | one | 4 | 1 |
| two | 0 | 6 |
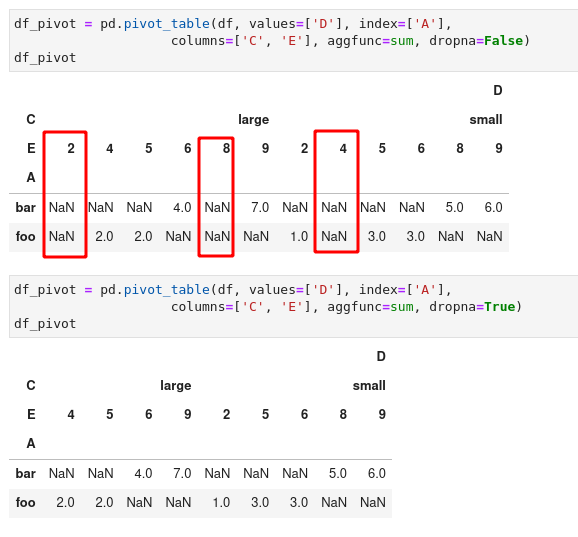
Pivot table remove NaN
To drop columns with NaN values we can use option dropna=True:
pd.pivot_table(df, values=['D'],
           	index=['A'], columns=['C', 'E'],
           	aggfunc=sum, dropna=True)
The result is pivot table without NaN columns:
Summary
To summarize, in this article, we've seen an example of a creation pivot table in Pandas. We've briefly discussed syntax and options.