


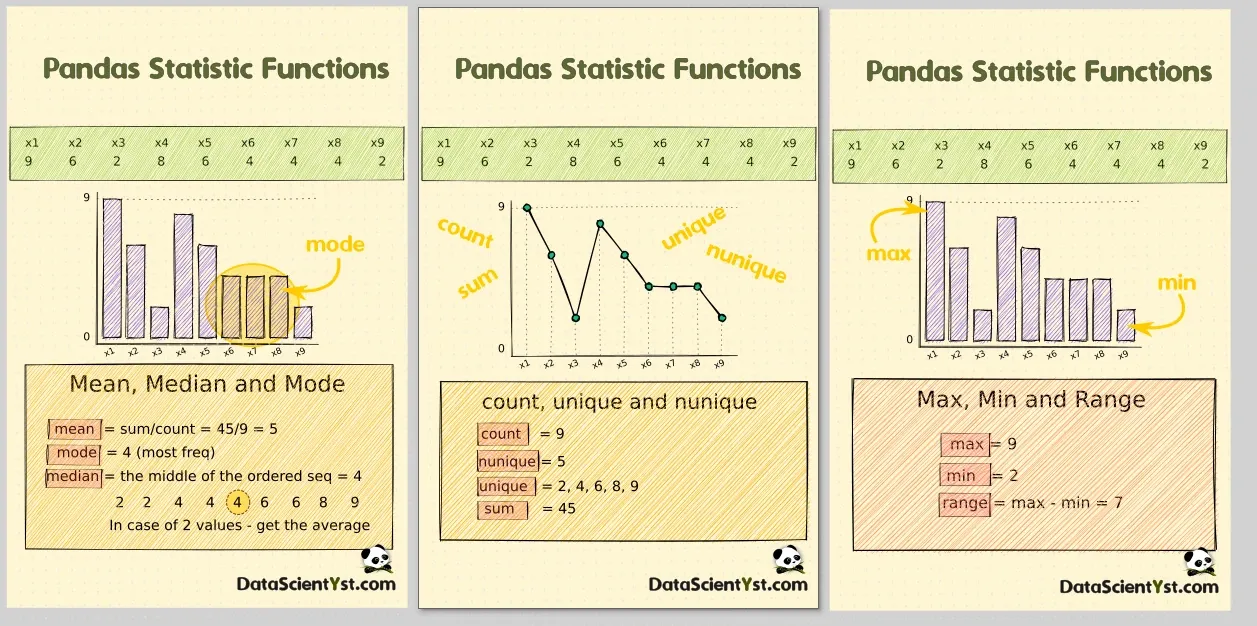
In this article, you can find the list of the available aggregation functions for groupby in Pandas:
count/nunique– non-null values / count number of unique valuesmin/max– minimum/maximumfirst/last- return first or last value per groupunique- all unique values from the groupstd– standard deviationsum– sum of valuesmean/median/mode– mean/median/modevar- unbiased variancemad- mean absolute deviationskew- unbiased skewsem- standard error of the meanquantile
Those functions can be used with groupby in order to return statistical information about the groups.
In the next section we will cover all aggregation functions with simple examples.
Step 1: Create DataFrame for aggfunc
Let us use the earthquake dataset. We are going to create new column year_month and groupby by it:
import pandas as pd

df = pd.read_csv(f'../data/earthquakes_1965_2016_database.csv.zip')
cols = ['Date', 'Time', 'Latitude', 'Longitude', 'Depth', 'Magnitude Type', 'Type', 'ID']
df = df[cols]
result:
| Date | Latitude | Longitude | Depth | Type |
|---|---|---|---|---|
| 01/02/1965 | 19.246 | 145.616 | 131.6 | Earthquake |
| 01/04/1965 | 1.863 | 127.352 | 80.0 | Earthquake |
| 01/05/1965 | -20.579 | -173.972 | 20.0 | Earthquake |
| 01/08/1965 | -59.076 | -23.557 | 15.0 | Earthquake |
| 01/09/1965 | 11.938 | 126.427 | 15.0 | Earthquake |
Next we are going to create new column with information - combination of the year and the month:
df['Date'] = pd.to_datetime(df['Date'], utc=True)
df['year_month'] = df['Date'].dt.to_period('M')
Step 2: Pandas describe DataFrame
In each step we will see examples of using each of the aggregating functions associated with Pandas groupby function.
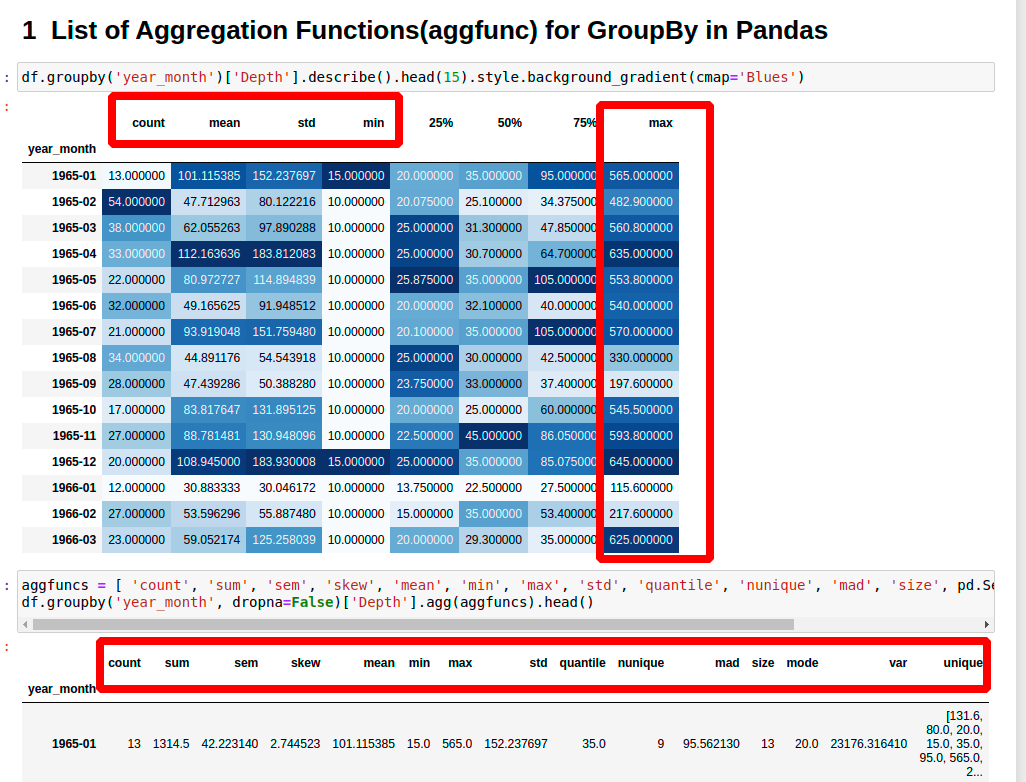
We will start with the method describe. This method returns basic information about the column:
df.groupby('year_month')['Depth'].describe()
describe returns multiple aggfunc-s like: count, mean, std, min, max:
| count | mean | std | min | 25% | 50% | 75% | max |
|---|---|---|---|---|---|---|---|
| 13.0 | 101.115385 | 152.237697 | 15.0 | 20.000 | 35.0 | 95.000 | 565.0 |
| 54.0 | 47.712963 | 80.122216 | 10.0 | 20.075 | 25.1 | 34.375 | 482.9 |
| 38.0 | 62.055263 | 97.890288 | 10.0 | 25.000 | 31.3 | 47.850 | 560.8 |
| 33.0 | 112.163636 | 183.812083 | 10.0 | 25.000 | 30.7 | 64.700 | 635.0 |
| 22.0 | 80.972727 | 114.894839 | 10.0 | 25.875 | 35.0 | 105.000 | 553.8 |
Step 3: Pandas all aggfunc for DataFrame
In this step you can find examples for all aggfunc-s applied on a DataFrame. The list of the functions is below.
Note that by default method groupby will exclude all NaN values. In order to change this behavior you can use parameter - dropna=False
aggfuncs = [ 'count', 'sum', 'sem', 'skew', 'mean', 'min', 'max',
'std', 'quantile', 'nunique', 'mad', 'size', pd.Series.mode, 'var', 'unique']
df.groupby('year_month', dropna=False)['Depth'].agg(aggfuncs)
result:
| year_month | 1965-01 | 1965-02 |
|---|---|---|
| count | 13 | 54 |
| sum | 1314.5 | 2576.5 |
| sem | 42.22314 | 10.903253 |
| skew | 2.744523 | 4.256526 |
| mean | 101.115385 | 47.712963 |
| min | 15.0 | 10.0 |
| max | 565.0 | 482.9 |
| std | 152.237697 | 80.122216 |
| quantile | 35.0 | 25.1 |
| nunique | 9 | 30 |
| mad | 95.56213 | 39.163306 |
| size | 13 | 54 |
| mode | 20.0 | 25.0 |
| var | 23176.31641 | 6419.569451 |
| unique | [131.6, 80.0, 20.0, 15.0, 35.0, 95.0, 565.0, 227.9, 55.0] | [482.9, 15.0, 10.0, 30.3, 30.0, 25.0, 20.0, 24.0, 31.8, 39.5, 30.4, 17.8, 27.7, 30.1, 37.4, 17.5, 22.5, 25.2, 17.7, 32.5, 200.0, 100.0, 53.5, 340.0, 55.0, 35.0, 40.4, 40.0, 20.3, 160.0] |
Step 4: Pandas aggfunc - Count, Nunique, Size, Unique
In this step we will cover 4 aggregation functions:
count- compute count of group, excluding missing valuessize- compute group sizesunique- return unique valuesnunique- return number of unique elements in the group.
Example of using the functions and the result:
aggfuncs = [ 'count', 'size', 'nunique', 'unique']
df.groupby('year_month')['Depth'].agg(aggfuncs)
output:
| count | size | nunique | unique | |
|---|---|---|---|---|
| year_month | ||||
| 1965-01 | 13 | 13 | 9 | [131.6, 80.0, 20.0, 15.0, 35.0, 95.0, 565.0, 227.9, 55.0] |
| 1965-02 | 54 | 54 | 30 | [482.9, 15.0, 10.0, 30.3, 30.0, 25.0, 20.0, 24.0, 31.8, 39.5, 30.4, 17.8, 27.7, 30.1, 37.4, 17.5, 22.5, 25.2, 17.7, 32.5, 200.0, 100.0, 53.5, 340.0, 55.0, 35.0, 40.4, 40.0, 20.3, 160.0] |
| 1965-03 | 38 | 38 | 24 | [30.0, 40.0, 33.6, 105.2, 10.0, 15.0, 14.8, 25.7, 200.0, 35.0, 560.8, 45.0, 50.0, 20.0, 207.8, 32.1, 25.0, 224.9, 28.9, 30.5, 48.8, 55.0, 70.0, 75.0] |
| 1965-04 | 33 | 33 | 22 | [60.0, 10.0, 30.7, 25.0, 20.0, 39.2, 50.0, 65.0, 17.5, 543.7, 635.0, 570.0, 421.7, 165.0, 15.0, 35.0, 70.0, 30.0, 36.8, 37.1, 64.7, 480.0] |
| 1965-05 | 22 | 22 | 16 | [15.0, 22.5, 90.0, 110.0, 10.0, 50.0, 153.1, 25.0, 35.0, 68.4, 120.0, 553.8, 28.5, 30.1, 125.0, 150.0] |
Step 5: Pandas aggfunc - First and Last
There are two functions which can return the first or the last value of the group. They are:
first- compute first of group valueslast- compute first of group values
Example of their usage:
aggfuncs = [ 'first', 'last']
df.groupby('year_month')['Depth'].agg(aggfuncs)
result:
| first | last | |
|---|---|---|
| year_month | ||
| 1965-01 | 131.6 | 55.0 |
| 1965-02 | 482.9 | 10.0 |
| 1965-03 | 30.0 | 75.0 |
| 1965-04 | 60.0 | 480.0 |
| 1965-05 | 15.0 | 150.0 |
Step 6: Pandas aggfunc - Sum, Min, Max
For numeric or datetime columns we can get the minimum, maximum or the sum by those aggfunc-s:
sum- compute sum of group valuesmin- compute min of group valuesmax- compute max of group values
How to get the sum, maximum and the minimum per group:
aggfuncs = [ 'sum', 'min', 'max']
df.groupby('year_month')['Depth'].agg(aggfuncs)
the result is:
| sum | min | max | |
|---|---|---|---|
| year_month | |||
| 1965-01 | 1314.5 | 15.0 | 565.0 |
| 1965-02 | 2576.5 | 10.0 | 482.9 |
| 1965-03 | 2358.1 | 10.0 | 560.8 |
| 1965-04 | 3701.4 | 10.0 | 635.0 |
| 1965-05 | 1781.4 | 10.0 | 553.8 |
Step 7: Pandas aggfunc - Mean, Median, Mode
There are several very important statistics which are:
- The mean is the average of a group values
- The mode is the most common number in a group
- The median is the middle of the group values
They are implemented in Pandas as functions:
mean- compute mean of groups, excluding missing valuespd.Series.mode- return the mode(s) of the Series.median- compute median of groups, excluding missing values.
They can be compute on Pandas groupby object by next syntax:
aggfuncs = [ 'mean', 'median', pd.Series.mode]
df.groupby('year_month')['Depth'].agg(aggfuncs)
result:
| mean | median | mode | |
|---|---|---|---|
| year_month | |||
| 1965-01 | 101.115385 | 35.0 | 20.0 |
| 1965-02 | 47.712963 | 25.1 | 25.0 |
| 1965-03 | 62.055263 | 31.3 | 30.0 |
| 1965-04 | 112.163636 | 30.7 | 25.0 |
| 1965-05 | 80.972727 | 35.0 | 35.0 |
Step 7: Pandas aggfunc - STD, MAD, Var
Another important methods in statistics are:
std- compute standard deviation of groups, excluding missing valuevar- compute variance of groups, excluding missing valuesmad- return the mean absolute deviation of the values over the requested axis
How to calculate the standard deviation, variance and mean absolute deviation of groups:
aggfuncs = ['mad', 'std', 'var']
df.groupby('year_month')['Depth'].agg(aggfuncs)
output:
| mad | std | var | |
|---|---|---|---|
| year_month | |||
| 1965-01 | 95.562130 | 152.237697 | 23176.316410 |
| 1965-02 | 39.163306 | 80.122216 | 6419.569451 |
| 1965-03 | 53.121745 | 97.890288 | 9582.508485 |
| 1965-04 | 129.843526 | 183.812083 | 33786.881761 |
| 1965-05 | 66.826446 | 114.894839 | 13200.823983 |
Step 7: Pandas aggfunc - Skew, Sem, quantile
Let's check few other functions which are not very popular like:
skew- return unbiased skew over requested axissem- compute standard error of the mean of groups, excluding missing valuesquantile- return group values at the given quantile, a la numpy.percentile
aggfuncs = [ 'skew', 'sem', 'quantile']
df.groupby('year_month')['Depth'].agg(aggfuncs)
result:
| skew | sem | quantile | |
|---|---|---|---|
| year_month | |||
| 1965-01 | 2.744523 | 42.223140 | 35.0 |
| 1965-02 | 4.256526 | 10.903253 | 25.1 |
| 1965-03 | 4.036620 | 15.879902 | 31.3 |
| 1965-04 | 2.054374 | 31.997576 | 30.7 |
| 1965-05 | 3.604639 | 24.495662 | 35.0 |
Step 8: User defined aggfunc for groupby
It's possible in Pandas to define your own aggfunc and use it with a groupby method.
In the next example we will define a function which will compute the NaN values in each group:
def countna(x):
    return (x.isna()).sum()

df.groupby('year_month')['Depth'].agg([countna])
result:
| countna | |
|---|---|
| year_month | |
| 1965-01 | 0 |
| 1965-02 | 0 |
| 1965-03 | 0 |
| 1965-04 | 0 |
| 1965-05 | 0 |
Step 9: Pandas aggfuncs from scipy or numpy
Finally let's check how to use aggregation functions with groupby from scipy or numpy
Below you can find a scipy example applied on Pandas groupby object:
from scipy import stats

df.groupby('year_month')['Depth'].agg(lambda x: stats.mode(x)[0])
result:
year_month
1965-01    20.0
1965-02    25.0
1965-03    30.0
1965-04    25.0
Example for numpy.count_nonzero method used with Pandas groupby method:
import numpy as np

df.groupby('year_month')['Depth'].agg(np.count_nonzero)
Output:
year_month
1965-01    13
1965-02    54
1965-03    38
1965-04    33
Resources
- Notebook
- pandas.core.groupby.DataFrameGroupBy.describe
- pandas.core.groupby.DataFrameGroupBy.count
- pandas.core.groupby.DataFrameGroupBy.size
- pandas.core.groupby.DataFrameGroupBy.nunique
- pandas.core.groupby.SeriesGroupBy.unique
- pandas.core.groupby.GroupBy.first
- pandas.core.groupby.GroupBy.last
- pandas.core.groupby.GroupBy.sum
- pandas.core.groupby.GroupBy.min
- pandas.core.groupby.GroupBy.max
- pandas.core.groupby.GroupBy.mean
- pandas.core.groupby.GroupBy.median
- pandas.Series.mode
- pandas.core.groupby.GroupBy.std
- pandas.core.groupby.GroupBy.var
- pandas.core.groupby.DataFrameGroupBy.mad
- pandas.core.groupby.DataFrameGroupBy.quantile
- pandas.core.groupby.DataFrameGroupBy.skew
- pandas.core.groupby.GroupBy.sem
- pandas.DataFrame.max
- pandas.DataFrame.min
- pandas.DataFrame.median
- pandas.DataFrame.mean
- pandas.DataFrame.sum
- pandas.DataFrame.count
- pandas.DataFrame.std
- pandas.DataFrame.mode
- pandas.DataFrame.var