To apply formatting and add borders to pivot tables in Pandas we can use style and set_table_styles.
You can find basic example on adding borders and formatting:
- adding borders
- coloring numbers based on values
- format NaN and float precision
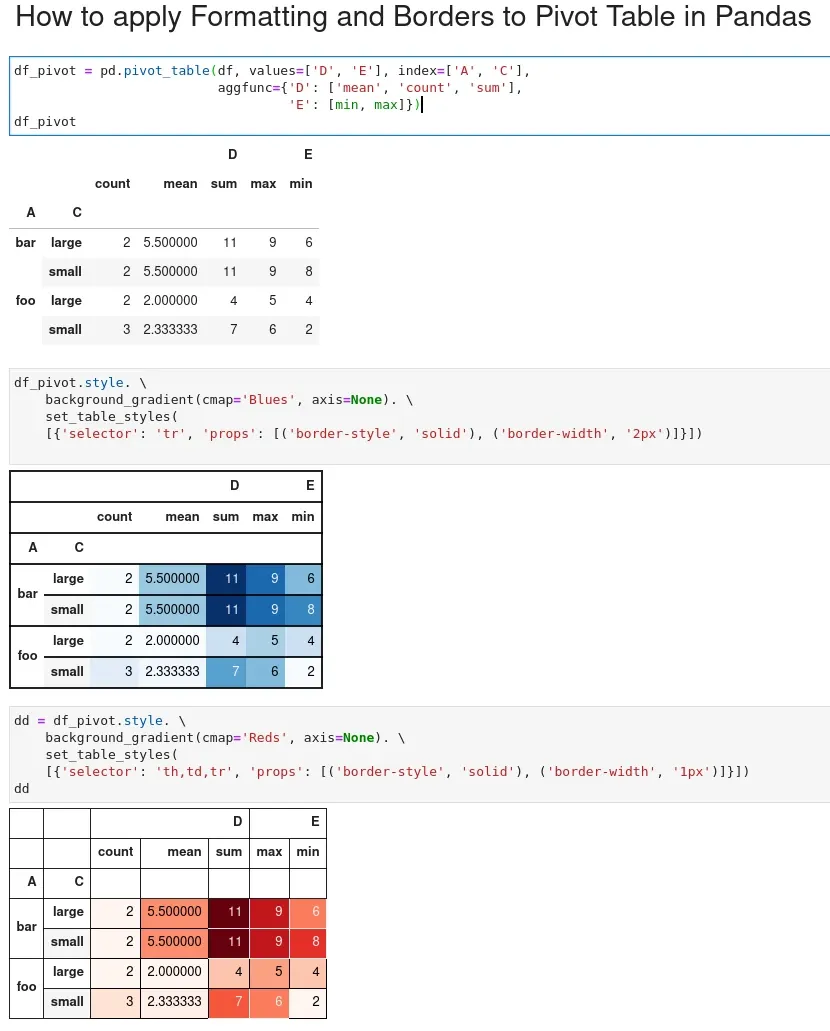
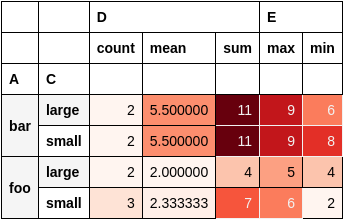
df_pivot.style. \
	background_gradient(cmap='Reds', axis=None). \
	set_table_styles(
	[{'selector': 'th,td,tr', 'props': [('border-style', 'solid'), ('border-width', '1px')]}]). \
    format(na_rep='', precision=2)
The result with formatting and borders of the pivot table is below:
In this short post, we'll see several examples of applying formatting and adding borders to Pandas DataFrame.
Setup
Let's say that we have the following data:
import pandas as pd

data = {"A": ["foo", "foo", "foo", "foo", "foo",
   	"bar", "bar", "bar", "bar"],
 "B": ["one", "one", "one", "two", "two",
   	"one", "one", "two", "two"],
 "C": ["small", "large", "large", "small",
   	"small", "large", "small", "small",
   	"large"],
 "D": [1, 2, 2, 3, 3, 4, 5, 6, 7],
 "E": [2, 4, 5, 5, 6, 6, 8, 9, 9]}


df = pd.DataFrame(data)
DataFrame looks like:
| A | B | C | D | E | |
|---|---|---|---|---|---|
| 0 | foo | one | small | 1 | 2 |
| 1 | foo | one | large | 2 | 4 |
| 2 | foo | one | large | 2 | 5 |
| 3 | foo | two | small | 3 | 5 |
| 4 | foo | two | small | 3 | 6 |
| 5 | bar | one | large | 4 | 6 |
| 6 | bar | one | small | 5 | 8 |
| 7 | bar | two | small | 6 | 9 |
| 8 | bar | two | large | 7 | 9 |
we will create pivot table by:
df_pivot = pd.pivot_table(df, values=['D', 'E'], index=['A', 'C'],
                      	aggfunc={'D': ['mean', 'count', 'sum'],
                               	'E': [min, max]})
df_pivot
Check this to learn more about: How To Create a Pivot Table in Pandas
Apply formatting to pivot table
To apply formatting to a pivoted DataFrame in Pandas, we can use the style property. In addition we can use the functions:
background_gradientformathighlight_nullset_caption
to control the formatting of the DataFrame.
Here's an example of how to apply:
- color gradient - summer
- highlight NaN values in red:
- add title to pivot DataFrame
- use brown for the column names
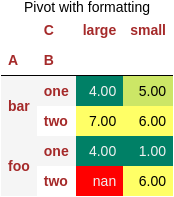
df_pivot.style.background_gradient(cmap='summer')\
	.format('{:.2f}')\
	.highlight_null(null_color='red')\
	.set_table_styles([{'selector': 'th', 'props': [('color', 'brown')]}])\
	.set_caption('Pivot with formatting')
The pivot table with formatting looks like:
Add borders to pivot table
Let's say that we would like to add borders to the pivot table. We are going to use style and set_table_styles. We can use CSS selectors:
th- header cell in a tabletr- row in a tabletd- cell in a table
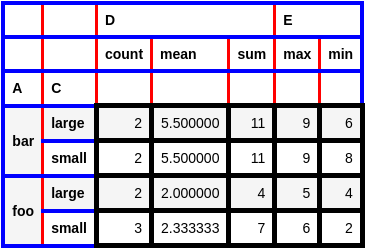
In this example you can find different border styles applied on each selector:
df_pivot.style. \
	set_table_styles([{'selector': 'tr',
                   	'props': [('border', '4px solid blue')]},
                  	{'selector': 'th',
                   	'props': [('border', '3px solid red')]},
                  	{'selector': 'td',
                   	'props': [('border', '5px solid black')]}])
Running the code will give as this table:
Summary
In this post, we saw how to apply formatting, table styles and borders to pivot tables in Pandas. The correct formatting and borders will make your pivot tables easier to digest.
As you can see from the image below by default pivot formatting makes the table hard to read: