


Looking to generate a list of different colors or get color names in Python? We are going to demonstrate combination of different modules like:
- pandas
- searborn
- webcolors
- matplotlib
In order to generate, list color names and values. Also we can see how to work with color palettes and HTML/CSS values.
If so, you'll see the options to accomplish these goals using simple examples.
Step 1: Generate N Random Colors with Python
In this step we will get a list of many different colors as hex values in Python. We are going to use pure Python code and will generate a list of unique colors with randomint and for loop:
from random import randint

color = []
n = 10

for i in range(n):
    color.append('#%06X' % randint(0, 0xFFFFFF))
This will generate a list like:
['#4E8CA1', '#F9C1E7', '#933D05', '#595697', '#417D22', '#7D8377', '#624F7B', '#C25D39', '#A24AFD', '#2AED9E']
You need to provide just the number of the random colors to be generated.
Step 2: Display N random colors with Python and JupyterLab
To display the different colors generated from the above code we are going to use Pandas.
First we are going to define a function which is going to display each row of a Pandas DataFrame in a different color(more example on formatting - How to Set Pandas DataFrame Background Color Based On Condition) :
from random import randint

def format_color_groups(df, color):

    x = df.copy()

    i = 0
    for factor in color:
        style = f'background-color: {color[i]}'
        x.loc[i] = style
        i = i + 1

    return x
Next we are going to generate a DataFrame with a random integers (more info - How to Create a Pandas DataFrame of Random Integers:
from random import randint
import numpy as np
import pandas as pd

color = []
n = 10
df = pd.DataFrame(np.random.randint(0,n,size=(n, 2)), columns=list('AB'))
Finally we are going to apply the function to the generated DataFrame and pass the list of colors:
df.style.apply(format_color_groups, color=color, axis=None)
This will result in:
| A | B | |
|---|---|---|
| 0 | 4 | 4 |
| 1 | 3 | 4 |
| 2 | 5 | 0 |
| 3 | 5 | 1 |
| 4 | 8 | 2 |
| 5 | 7 | 4 |
| 6 | 3 | 2 |
| 7 | 5 | 0 |
| 8 | 2 | 1 |
| 9 | 8 | 9 |
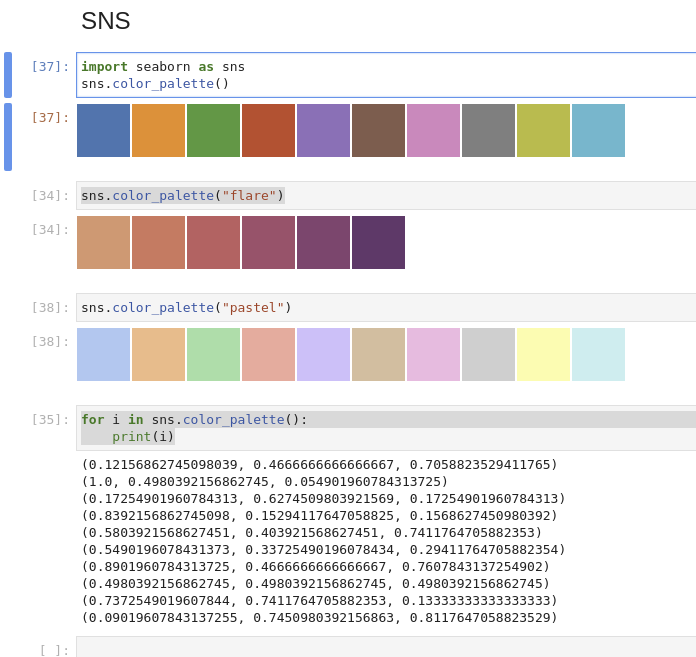
Step 3: Get color palette with seaborn and Python
Python package seaborn offers color palettes with different styles. You can find more about it: seaborn.color_palette
Below you can find a simple example:
import seaborn as sns
sns.color_palette()
or
sns.color_palette("flare")
sns.color_palette("pastel")
You can find the generated colors on the image below:
How many colors to generate depends on a parameter:
palette = sns.color_palette(None, 3)
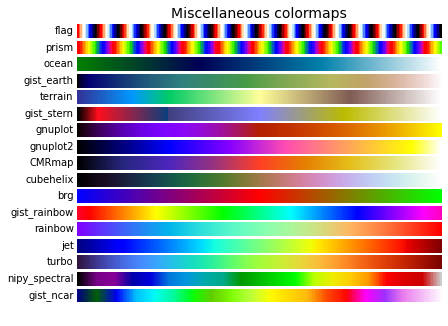
Step 4: Get color palette with matplotlib
Another option to get different color palettes in Python is with the package matplotlib. After installing it you can generate different color ranges with code like:
import numpy as np
import matplotlib as mpl
import matplotlib.pyplot as plt
from matplotlib import cm
from collections import OrderedDict

cmaps = OrderedDict()

cmaps['Miscellaneous'] = [
            'flag', 'prism', 'ocean', 'gist_earth', 'terrain', 'gist_stern',
            'gnuplot', 'gnuplot2', 'CMRmap', 'cubehelix', 'brg',
            'gist_rainbow', 'rainbow', 'jet', 'turbo', 'nipy_spectral',
            'gist_ncar']

gradient = np.linspace(0, 1, 256)
gradient = np.vstack((gradient, gradient))


def plot_color_gradients(cmap_category, cmap_list):
    # Create figure and adjust figure height to number of colormaps
    nrows = len(cmap_list)
    figh = 0.35 + 0.15 + (nrows + (nrows - 1) * 0.1) * 0.22
    fig, axs = plt.subplots(nrows=nrows + 1, figsize=(6.4, figh))
    fig.subplots_adjust(top=1 - 0.35 / figh, bottom=0.15 / figh,
                        left=0.2, right=0.99)
    axs[0].set_title(cmap_category + ' colormaps', fontsize=14)

    for ax, name in zip(axs, cmap_list):
        ax.imshow(gradient, aspect='auto', cmap=plt.get_cmap(name))
        ax.text(-0.01, 0.5, name, va='center', ha='right', fontsize=10,
                transform=ax.transAxes)

    # Turn off *all* ticks & spines, not just the ones with colormaps.
    for ax in axs:
        ax.set_axis_off()


for cmap_category, cmap_list in cmaps.items():
    plot_color_gradients(cmap_category, cmap_list)

plt.show()
More information can be found: Choosing Colormaps in Matplotlib
Step 5: Working with color names and color values format (HTML and CSS) in Python
Additional library webcolors is available if you need to:
- get the color name in Python
- convert color name to HTML/CSS or hex format
More about this Python module: webcolors.
And example usage of converting hex value to color name:
import webcolors
webcolors.hex_to_name(u'#daa520')
webcolors.hex_to_name(u'#000000')
webcolors.hex_to_name(u'#FFFFFF')
Which will produce:
- 'goldenrod'
- 'black'
- 'white'
On the other hand if you like to get the color value based on its name you can do:
webcolors.html5_parse_legacy_color(u'lime')
webcolors.html5_parse_legacy_color(u'salmon')
Will result in:
- HTML5SimpleColor(red=0, green=255, blue=0)
- HTML5SimpleColor(red=250, green=128, blue=114)