


In this post, we will Pandas and Python to collect football data and analyse it. We will try to predict probability for the outcome and the result of the fooball game between: Barcelona vs Real Madrid.
Today is a great day for football fans - Barcelona vs Real Madrid game will be held tomorrow. Fans try to predict:
- Who is better: Barca or Real?
- Who won the most El Clasico?
- Who will win the game?
- Barcelona vs Real Madrid - Prediction, Odds and Betting Tips
Can we use data science to find answers to those questions? Let's give it a try.
From this post you can learn:
- Scraping tables with Pandas
- Pivot/unpivot tables
- Pandas chaining
- Fuzzy string matching in Python
- Basic implementation in Python of:
- Markov chain
- ML model
At the end there is a link to Python playbook in Kaggle.
1. Collect stats
Often things start with data collection. Nowadays it is much easier to collect data. Below you can find few ways to scrape football data with Python:
Wikipedia - Historical data
Wikipedia is a great source of information for El Clasico. We will use Pandas method pd.read_html to collect first table on the page:
import pandas as pd

url = 'https://en.wikipedia.org/wiki/List_of_El_Cl%C3%A1sico_matches'
df = pd.read_html(url)[0]
df
data looks like:
| No. | Date | Matchweek | Home team | Away team | Score (FT/HT) | Goals (Home) | Goals (Away) | |
|---|---|---|---|---|---|---|---|---|
| 0 | 1 | 17 February 1929 | 2 | Barcelona | Real Madrid | 1–2 (0–1) | Parera (70) | Morera (10, 55) |
| 1 | 2 | 9 May 1929 | 11 | Real Madrid | Barcelona | 0–1 (0–0) | NaN | Sastre (83) |
| 2 | 3 | 26 January 1930 | 9 | Barcelona | Real Madrid | 1–4 (0–3) | Bestit (63) | Rubio (10, 37), F. López (17), Lazcano (71) |
| 3 | 4 | 30 March 1930 | 18 | Real Madrid | Barcelona | 5–1 (3–0) | Rubio (5, 23), Lazcano (42, 68, 72) | Goiburu (84) |
| 4 | 5 | 1 February 1931 | 9 | Real Madrid | Barcelona | 0–0 | NaN | NaN |
Wikipedia - Current season
To get the current results standings we can use wikipedia again with the following code:
import pandas as pd

url = 'https://en.wikipedia.org/wiki/2022%E2%80%9323_La_Liga'
df = pd.read_html(url)[6]
df
You can find the table which we are scraping
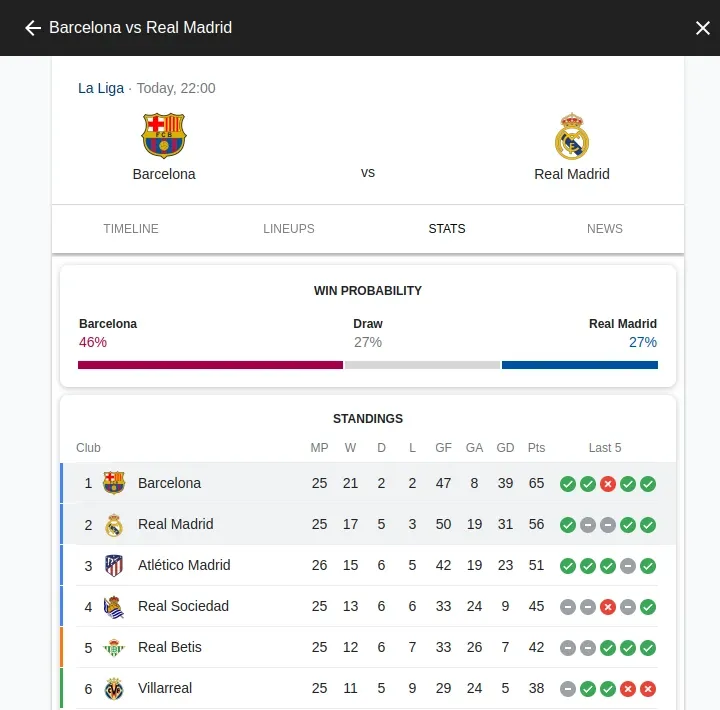
We can use google to search for the latests games and win probability by: barcelona vs real madrid.
Which will give us:
I'm using browser extension to extract the table: Table Capture
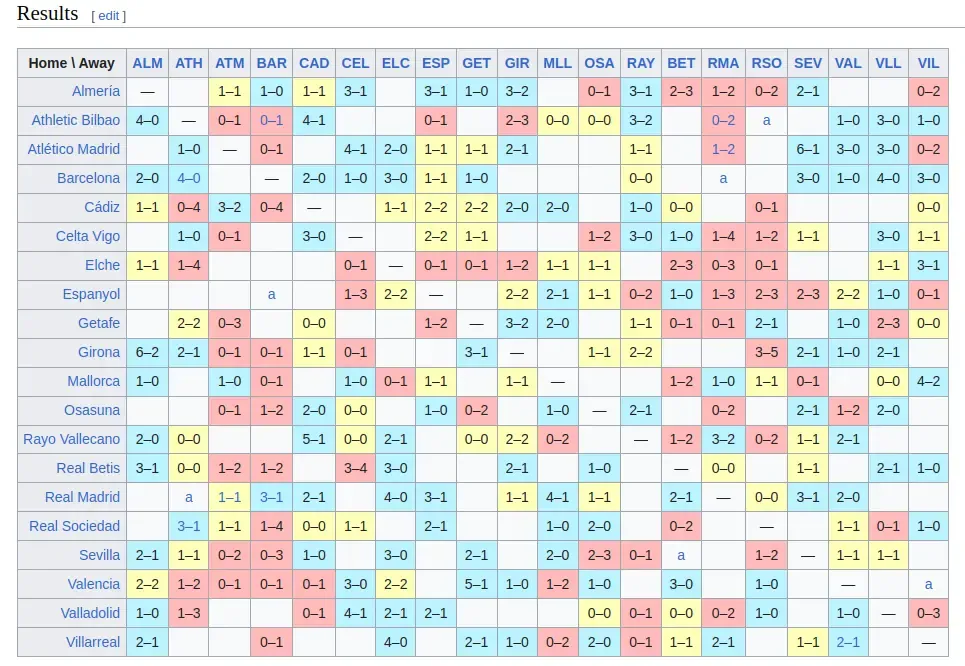
2. Transform Data
Table below is stored in pivot or aggregated mode. In this step we will transform the data to a normal form.
melt column names to values
What we like to achieve is the following format:
| Home \ Away | variable | value | corr | |
|---|---|---|---|---|
| 0 | Almería | ALM | — | VAL |
| 1 | Athletic Bilbao | ALM | 4–0 | NaN |
| 2 | Atlético Madrid | ALM | NaN | ATM |
| 3 | Barcelona | ALM | 2–0 | NaN |
| 4 | Cádiz | ALM | 1–1 | ELC |
Pandas offer method melt which can turn columns into rows/values:
df_melt = pd.melt(df, id_vars=['Home \ Away'])
df_melt
3. Match abbreviations and full names
We have two different names of the teams:
- full name
- abbreviation
We will use basic fuzzy string matching to map them - we will cover two ways for mapping:
difflib
Module difflib is very powerful and offers a quick way to match similar strings. In our case we can try to map abbreviations and full names by method get_close_matches:
teams = ['Real Madrid', 'Real Sociedad', 'Rayo Vallecano']
difflib.get_close_matches('RSO', teams, n=3, cutoff=0.2)
First we can collect all names and run test for similarity by:
full_names = df_melt['Home \ Away'].unique()
abbr_names = df_melt['variable'].unique()

for keyword in abbr_names:
	matches = difflib.get_close_matches(keyword, full_names, n=20, cutoff=0.2)
	print(keyword, matches)
Results are far for perfect:
ALM ['Atlético Madrid', 'Almería']
ATH ['Almería']
ATM ['Atlético Madrid', 'Almería']
BAR ['Almería']
CAD ['Cádiz', 'Almería']
CEL ['Elche', 'Cádiz']
ELC ['Elche', 'Cádiz']
ESP ['Elche', 'Sevilla']
GET ['Elche', 'Girona', 'Getafe']
So the full code for Pandas to match the teams would be:
import difflib

correct_values = {}
words = full_names

for keyword in abbr_names:
	similar = difflib.get_close_matches(keyword, words, n=3, cutoff=0.2)
	for x in similar:
    	correct_values[x] = keyword

df_melt["corr"] = df_melt["Home \ Away"].map(correct_values)
This method is very generic and produces results with errors.
Regex to match name and abbreviation
Let's try one more way to match abbreviations to possible names by using regex. This way is adjusted to the logic of abbreviating football teams.
The code is:
import re
def is_abbrev(abbrev, words):
	matches = []
	for word in words:
    	pattern = "(|.*\s)".join(abbrev.lower())
    	if re.match("^" + pattern, word.lower()) is not None:
        	matches.append(word)
	return matches

for keyword in abbr_names:
	matches = is_abbrev(keyword, full_names)
	print(keyword, matches)
and the results are much better:
ALM ['Almería']
ATH ['Athletic Bilbao']
ATM ['Atlético Madrid']
BAR ['Barcelona']
CAD []
CEL ['Celta Vigo']
ELC ['Elche']
ESP ['Espanyol']
GET ['Getafe']
GIR ['Girona']
MLL []
Now we can export all games between Barcelona and Real Madrid. We can also find their latest games in Spain.
4. Python: odds in sport
This is a definition from wikipedia about odds:
In probability theory, odds provide a measure of the likelihood of a particular outcome. They are calculated as the ratio of the number of events that produce that outcome to the number that do not.
You can find more about this in the Resource section.
soccerapi
Below you can find simple way to collect odds in Python by using library -soccerapi - pip install soccerapi:
from soccerapi.api import Api888Sport

api = Api888Sport()
url = 'https://www.888sport.com/#/filter/football/spain/'
odds = api.odds(url)

pd.DataFrame(odds)
This will collect all odds for Spain:
| time | home_team | away_team | full_time_result | under_over | both_teams_to_score | double_chance | |
|---|---|---|---|---|---|---|---|
| 0 | 2023-04-04T19:00:00Z | Athletic Bilbao | Osasuna | {'1': 1460, 'X': 4000, '2': 7500} | {'O2.5': 2140, 'U2.5': 1730} | {'yes': 2250, 'no': 1610} | {'1X': 1110, '12': 1260, '2X': 2500} |
| 1 | 2023-04-05T19:00:00Z | FC Barcelona | Real Madrid | {'1': 2250, 'X': 3400, '2': 3100} | {'O2.5': 1830, 'U2.5': 2000} | {'yes': 1650, 'no': 2180} | {'1X': 1380, '12': 1330, '2X': 1610} |
| 2 | 2023-04-07T16:30:00Z | Lugo | Tenerife | {'1': 4100, 'X': 2750, '2': 2020} | {'O2.5': 1630, 'U2.5': 2200} | {'yes': 2430, 'no': 1520} | {'1X': 1740, '12': 1410, '2X': 1220} |
| 3 | 2023-04-07T19:00:00Z | Villarreal B | Málaga | {'1': 1930, 'X': 3250, '2': 3700} | {'O2.5': 2200, 'U2.5': 1630} | {'yes': 1980, 'no': 1780} | {'1X': 1260, '12': 1320, '2X': 1810} |
| 4 | 2023-04-07T19:00:00Z | Sevilla | Celta Vigo | {'1': 2150, 'X': 3300, '2': 3400} | {'O2.5': 2250, 'U2.5': 1640} | {'yes': 1980, 'no': 1780} | {'1X': 1330, '12': 1340, '2X': 1670} |
We can find the odds for: FC Barcelona and Real Madrid: {'1': 2250, 'X': 3400, '2': 3100}.
sports-betting
Another useful Python package for betting is: sports-betting. It can be installed by: pip install sports-betting
This package require Python 3.9+ and offer simple API:
from sportsbet.datasets import SoccerDataLoader
dataloader = SoccerDataLoader(param_grid={'league': ['Italy'], 'year': [2020]})
X_train, Y_train, O_train = dataloader.extract_train_data(odds_type='market_maximum', drop_na_thres=1.0)
X_fix, Y_fix, O_fix = dataloader.extract_fixtures_data()
Calculate odds
We can follow the next steps in order to calculate the odds in a custom code:
- Barcelona has a home advantage.
- Barcelona has (out of their last 10 games):
- won 7
- drawn 1
- lost 2
- Real Madrid:
- won 6
- drawn 2
- lost 2
To calculate the odds for this match, we can use simple Python code:
barca_win_rate = 7 / 10
real_win_rate = 6 / 10
draw_rate = 1 - barca_win_rate - real_win_rate

barca_odds = 1 / barca_win_rate
real_odds = 1 / real_win_rate
draw_odds = 1 / draw_rate

print("Barcelona odds:", barca_odds)
print("Real Madrid odds:", real_odds)
print("Draw odds:", draw_odds)
which give us:
Barcelona odds: 1.4285714285714286
Real Madrid odds: 1.6666666666666667
Draw odds: -3.333333333333334
5. Python Markov Chain
Finally we can use Markov Chains to calculate probability for win, draw and lose.
Collect data
We will collect all previous el clasico games by:
import pandas as pd

url = 'http://eurorivals.net/head-to-head/barcelona-vs-real-madrid'

df_el_cl = pd.read_html(url)[1]
df_el_cl.head()
result:
| Unnamed: 0 | Unnamed: 1 | Unnamed: 2 | Unnamed: 3 | Unnamed: 4 | Unnamed: 5 | |
|---|---|---|---|---|---|---|
| 0 | 2023 19 March | NaN | Primera | Barcelona | 2 - 1 | Real Madrid |
| 1 | 2023 2 March | NaN | Cup | Real Madrid | 0 - 1 | Barcelona |
| 2 | 2022 16 October | NaN | Primera | Real Madrid | 3 - 1 | Barcelona |
| 3 | 2022 20 March | NaN | Primera | Real Madrid | 0 - 4 | Barcelona |
| 4 | 2021 24 October | NaN | Primera | Barcelona | 1 - 2 | Real Madrid |
Data cleaning with Panda chaining
In this step we will demonstrate how to use Pandas chaining for data cleaning and preprocessing:
import numpy as np

df_trans = (
df
  .set_axis(['date', 'flag', 'tournament', 'home', 'score', 'away'], axis=1) # rename columns
  .drop('flag', axis=1) # drop columns
  .assign(score_home=lambda x: x.score.str.split('-', expand=True)[0].astype(int)) # split and add new column
  .assign(score_away=lambda x: x.score.str.split('-', expand=True)[1].astype(int)) # split and add new column
  .assign(date_n=lambda x: pd.to_datetime(x.date)) # convert to datetime
  .assign(goal_diff=lambda x: x.score_home - x.score_away) # compare two columns
  .assign(result= lambda x: x['goal_diff'].apply(lambda y: "L" if y < 0 else ("W" if y > 0 else "D"))) # conditional in chaining
  .set_index('date_n') # set new index
  .sort_index()  # sort by index
  .loc[:,['home', 'away', 'score_home', 'score_away', 'result']] # return column from chaining
)
After the preprocessing we have this data:
| home | away | score_home | score_away | result | |
|---|---|---|---|---|---|
| date_n | |||||
| 2004-04-24 | Real Madrid | Barcelona | 1 | 2 | L |
| 2004-11-19 | Barcelona | Real Madrid | 3 | 0 | W |
| 2005-04-09 | Real Madrid | Barcelona | 4 | 2 | W |
| 2005-11-18 | Real Madrid | Barcelona | 0 | 3 | L |
| 2006-03-31 | Barcelona | Real Madrid | 1 | 1 | D |
| 2006-10-22 | Real Madrid | Barcelona | 2 | 0 | W |
| 2007-03-10 | Barcelona | Real Madrid | 3 | 3 | D |
| 2007-12-23 | Barcelona | Real Madrid | 0 | 1 | L |
| 2008-05-07 | Real Madrid | Barcelona | 4 | 1 | W |
| 2008-12-13 | Barcelona | Real Madrid | 2 | 0 | W |
| 2009-05-02 | Real Madrid | Barcelona | 2 | 6 | L |
| 2009-11-29 | Barcelona | Real Madrid | 1 | 0 | W |
| 2010-04-10 | Real Madrid | Barcelona | 0 | 2 | L |
| 2010-11-29 | Barcelona | Real Madrid | 5 | 0 | W |
| 2011-04-16 | Real Madrid | Barcelona | 1 | 1 | D |
| 2011-04-20 | Barcelona | Real Madrid | 0 | 0 | D |
| 2011-04-27 | Real Madrid | Barcelona | 0 | 2 | L |
| 2011-05-03 | Barcelona | Real Madrid | 1 | 1 | D |
| 2011-12-10 | Real Madrid | Barcelona | 1 | 3 | L |
| 2012-01-18 | Real Madrid | Barcelona | 1 | 2 | L |
| 2012-01-25 | Barcelona | Real Madrid | 1 | 2 | L |
| 2012-04-21 | Barcelona | Real Madrid | 1 | 2 | L |
| 2012-10-07 | Barcelona | Real Madrid | 2 | 2 | D |
| 2013-01-30 | Real Madrid | Barcelona | 1 | 1 | D |
| 2013-02-26 | Barcelona | Real Madrid | 1 | 3 | L |
| 2013-03-02 | Real Madrid | Barcelona | 2 | 1 | W |
| 2013-10-26 | Barcelona | Real Madrid | 2 | 1 | W |
| 2014-03-23 | Real Madrid | Barcelona | 3 | 4 | L |
| 2014-04-16 | Barcelona | Real Madrid | 1 | 2 | L |
| 2014-10-25 | Real Madrid | Barcelona | 3 | 1 | W |
| 2015-03-22 | Barcelona | Real Madrid | 2 | 1 | W |
| 2015-11-21 | Real Madrid | Barcelona | 0 | 4 | L |
| 2016-04-02 | Barcelona | Real Madrid | 1 | 2 | L |
| 2016-12-03 | Barcelona | Real Madrid | 1 | 1 | D |
| 2017-04-23 | Real Madrid | Barcelona | 2 | 3 | L |
| 2017-12-23 | Real Madrid | Barcelona | 0 | 3 | L |
| 2018-05-06 | Barcelona | Real Madrid | 2 | 2 | D |
| 2018-10-28 | Barcelona | Real Madrid | 5 | 1 | W |
| 2019-02-06 | Barcelona | Real Madrid | 1 | 1 | D |
| 2019-02-27 | Real Madrid | Barcelona | 0 | 3 | L |
| 2019-03-02 | Real Madrid | Barcelona | 0 | 1 | L |
| 2019-12-18 | Barcelona | Real Madrid | 0 | 0 | D |
| 2020-03-01 | Real Madrid | Barcelona | 2 | 0 | W |
| 2020-10-24 | Barcelona | Real Madrid | 1 | 3 | L |
| 2021-04-10 | Real Madrid | Barcelona | 2 | 1 | W |
| 2021-10-24 | Barcelona | Real Madrid | 1 | 2 | L |
| 2022-03-20 | Real Madrid | Barcelona | 0 | 4 | L |
| 2022-10-16 | Real Madrid | Barcelona | 3 | 1 | W |
| 2023-03-02 | Real Madrid | Barcelona | 0 | 1 | L |
| 2023-03-19 | Barcelona | Real Madrid | 2 | 1 | W |
Markov chains probability
We will use package mchmm which can be installed by: pip install mchmm
In order to find the transition matrix and plot graph of probability changes:
import mchmm as mc
a = mc.MarkovChain().from_data(df_trans['result'])
So we get probability matrix by:
a.observed_p_matrix
results into:
array([[0.18181818, 0.54545455, 0.27272727],
[0.26086957, 0.34782609, 0.39130435],
[0.2 , 0.53333333, 0.26666667]])
or as a table:
| 0 | 1 | 2 | |
|---|---|---|---|
| 0 | 0.181818 | 0.545455 | 0.272727 |
| 1 | 0.260870 | 0.347826 | 0.391304 |
| 2 | 0.200000 | 0.533333 | 0.266667 |
And the following transition graph by:
graph = a.graph_make(
  	format="png",
  	graph_attr=[("rankdir", "LR")],
  	node_attr=[("fontname", "Roboto bold"), ("fontsize", "20")],
  	edge_attr=[("fontname", "Iosevka"), ("fontsize", "12")]
	)
graph.render()
graph:
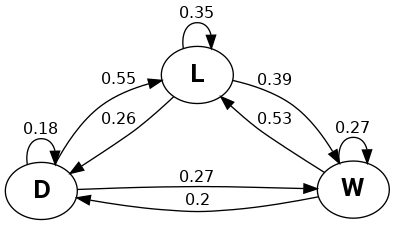
So the draw state seems to be less favorable. After winning, often there is a loss.
Note: We don't take into account home and away teams.
6. Predict score with simple ML model
Finally we can try to predict the score based on the scores so far. We can use simple ML model with:
- inputs - home and away teams
- outputs - home and away scores
The code is:
from sklearn.linear_model import LinearRegression

mapping = {'Barcelona':1, 'Real Madrid':2}
df_trans = df_trans.replace(mapping).head()

TRAIN_INPUT = df_trans[['home', 'away']].values
TRAIN_OUTPUT = df_trans[['score_home', 'score_away']].values

X_TEST = [[2,  1]]
outcome = predictor.predict(X=X_TEST)
coefficients = predictor.coef_

print(outcome)
print('Outcome : Coefficients : {}'.format(coefficients))
which give us:
[[1.66666667 2.33333333]]
Outcome : Coefficients : [[-0.16666667 0.16666667]
[ 0.91666667 -0.91666667]]
Note: this is a pretty naive way to try to predict score in Football.
7. Resources
Helpful resources for aspiring data scientists who would like to research football by data science deeper:
- Notebook
- How to Melt Pandas DataFrame
- difflib — Helpers for computing deltas
- Data Source
- Odds
- Python packages
- soccerapi - wrapper build on top of some bookmakers (888sport, bet365 and Unibet) in order to get data about soccer (aka football) odds using python commands
- sports-betting - collection of tools that makes it easy to create machine learning models for sports betting
- mchmm - Markov chains and Hidden Markov models