


In this quick tutorial, we'll see how to use melt in Pandas. We'll first look into basic pd.melt usage, then pd.melt() parameters, and finally some advanced examples and alternatives of melt in Pandas and Python.
In short we can do:
(1) pd.melt() in Pandas
pd.melt(df, id_vars=['A'], value_vars=['B'])
(2) pd.melt() and MultiIndex
pd.melt(df, id_vars=[('A', 'D')], value_vars=[('B', 'E')])
Setup
In this article we will use DataFrame which has information for population of countries:
import pandas as pd

data = [{"Country":"China","1950":"562,580","1955":"607,047","1960":"651,340","1980":"987,822","continent":"Asia"},
        {"Country":"India","1950":"369,881","1955":"404,268","1960":"445,394","1980":"684,888","continent":"Asia"},
        {"Country":"United States","1950":"151,869","1955":"165,070","1960":"179,980","1980":"227,225","continent":"N. America"},
        {"Country":"Indonesia","1950":"82,979","1955":"90,255","1960":"100,146","1980":"150,322","continent":"Asia"},
        {"Country":"Russia","1950":"101,937","1955":"111,126","1960":"119,632","1980":"139,039","continent":"Europe"},
        {"Country":"Brazil","1950":"53,444","1955":"61,652","1960":"71,412","1980":"121,064","continent":"S. America"}]

pd.DataFrame(data)
Final data format is perfect example of where Pandas melt function is useful:
| Country | 1950 | 1955 | 1960 | 1980 | continent | |
|---|---|---|---|---|---|---|
| 0 | China | 562,580 | 607,047 | 651,340 | 987,822 | Asia |
| 1 | India | 369,881 | 404,268 | 445,394 | 684,888 | Asia |
| 2 | United States | 151,869 | 165,070 | 179,980 | 227,225 | N. America |
| 3 | Indonesia | 82,979 | 90,255 | 100,146 | 150,322 | Asia |
| 4 | Russia | 101,937 | 111,126 | 119,632 | 139,039 | Europe |
| 5 | Brazil | 53,444 | 61,652 | 71,412 | 121,064 | S. America |
1: What is melt in Pandas
The picture below shows melt function in action
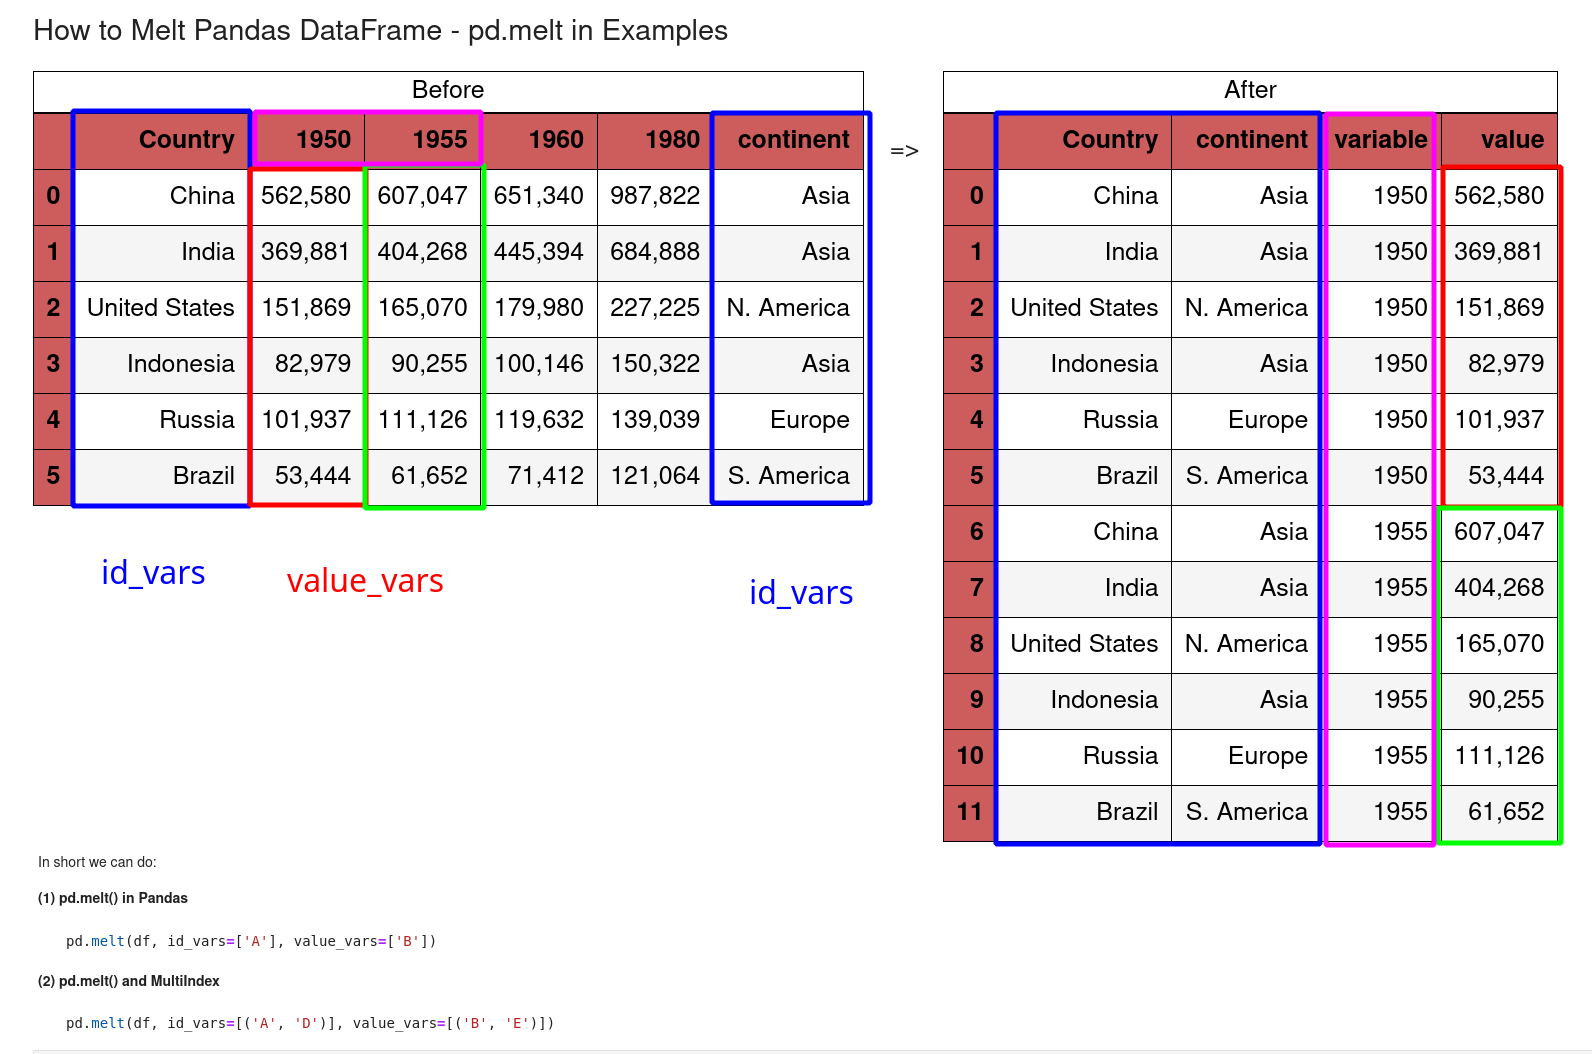
There are 2 important parameters of this method:
id_vars- identifier variablesvalue_vars- measured variables, which are "melt" or "unpivoted" to row axis (non-identifier columns)value- is the column valuesvariable- the column names
So the melt function will turn multiple columns - value_vars - to rows. There will be two non-identifier columns.
There are id_vars - identifier variables which will be considered as identifier columns.
In short
pd.melt()unpivots data. It makes it easier to filter, compare, visualize and use in DB like style.
2: Why is melt useful
Pandas melt function is useful when data is in form of:
- pivot
- pivot table
- cross table
And we need to convert the multiple columns to rows.
Looking at the data above we might want to find the top 5 most populated pairs - year and country. Using melt() will help us to get this information much faster.
The reverse operation of melt can be found on: Opposite of Melt in Python and Pandas
3: Pandas melt example
Let's see how to use the melt function. First we will identify the parameters:
id_vars=['Country', 'continent']value_vars=['1950', '1955']
pd.melt(df, id_vars=['Country', 'continent'], value_vars=['1950', '1955'])
This would result into:
| Country | continent | variable | value | |
|---|---|---|---|---|
| 0 | China | Asia | 1950 | 562,580 |
| 1 | India | Asia | 1950 | 369,881 |
| 2 | United States | N. America | 1950 | 151,869 |
| 3 | Indonesia | Asia | 1950 | 82,979 |
| 4 | Russia | Europe | 1950 | 101,937 |
| 5 | Brazil | S. America | 1950 | 53,444 |
| 6 | China | Asia | 1955 | 607,047 |
| 7 | India | Asia | 1955 | 404,268 |
| 8 | United States | N. America | 1955 | 165,070 |
| 9 | Indonesia | Asia | 1955 | 90,255 |
| 10 | Russia | Europe | 1955 | 111,126 |
| 11 | Brazil | S. America | 1955 | 61,652 |
So the output has 4 columns:
- 2 identifier columns
- Country
- continent
- 2 non identifier columns
- variable
- value
If we add more value_vars columns the number of the columns will be the same. Only id_vars change the number of the output columns.
4: Pandas melt - change names
If we like to change the non-identifier columns we can use 2 parameters:
var_namevalue_name
and set the new names for the result columns:
pd.melt(df, id_vars=['Country', 'continent'], value_vars=['1950', '1955'],
              var_name ='year', value_name ='value')
5: Pandas melt - parameters
There are several parameters of melt function. Most of them were mentioned in the article.
Two remains to be described:
col_level- specifies the level to melt (MultiIndex)ignore_index- ignore the original index
6: Pandas melt - MultiIndex
Melt function can be used for MultiIndex DataFrame.
To simulate melt function for MultiIndex we will turn the columns into MultiIndex by:
df = pd.concat({'year': df}, names=['Firstlevel'], axis=1)
More about: How to Add a Level to Index in Pandas DataFrame
We can check the columns by:
df.columns
result:
MultiIndex([('year',   'Country'),
        ('year',      '1950'),
        ('year',      '1955'),
        ('year',      '1960'),
        ('year',      '1980'),
        ('year', 'continent')],
       names=['Firstlevel', None])
Melt can be invoked on MultiIndex columns by:
pd.melt(df, id_vars=[('year', 'Country')], value_vars=[('year', '1950'), ('year', '1955')])
The result is:
| (year, Country) | Firstlevel | None | value | |
|---|---|---|---|---|
| 0 | China | year | 1950 | 562,580 |
| 1 | India | year | 1950 | 369,881 |
| 2 | United States | year | 1950 | 151,869 |
| 3 | Indonesia | year | 1950 | 82,979 |
| 4 | Russia | year | 1950 | 101,937 |
| 5 | Brazil | year | 1950 | 53,444 |
| 6 | China | year | 1955 | 607,047 |
| 7 | India | year | 1955 | 404,268 |
| 8 | United States | year | 1955 | 165,070 |
| 9 | Indonesia | year | 1955 | 90,255 |
| 10 | Russia | year | 1955 | 111,126 |
| 11 | Brazil | year | 1955 | 61,652 |
Conclusion
Pandas melt is a very useful function for reshaping DataFrames. It can multiple columns to rows.
We saw how it works, why it's important and several examples. The function can help "unpivoting" data.