


This article is about Exploratory Data Analysis(EDA) in Pandas and Python. The article will explain step by step how to do Exploratory Data Analysis plus examples.
EDA is an important step in Data Science. The goal of EDA is to identify errors, insights, relations, outliers and more.
The image below illustrate the data science workflow and where EDA is located:
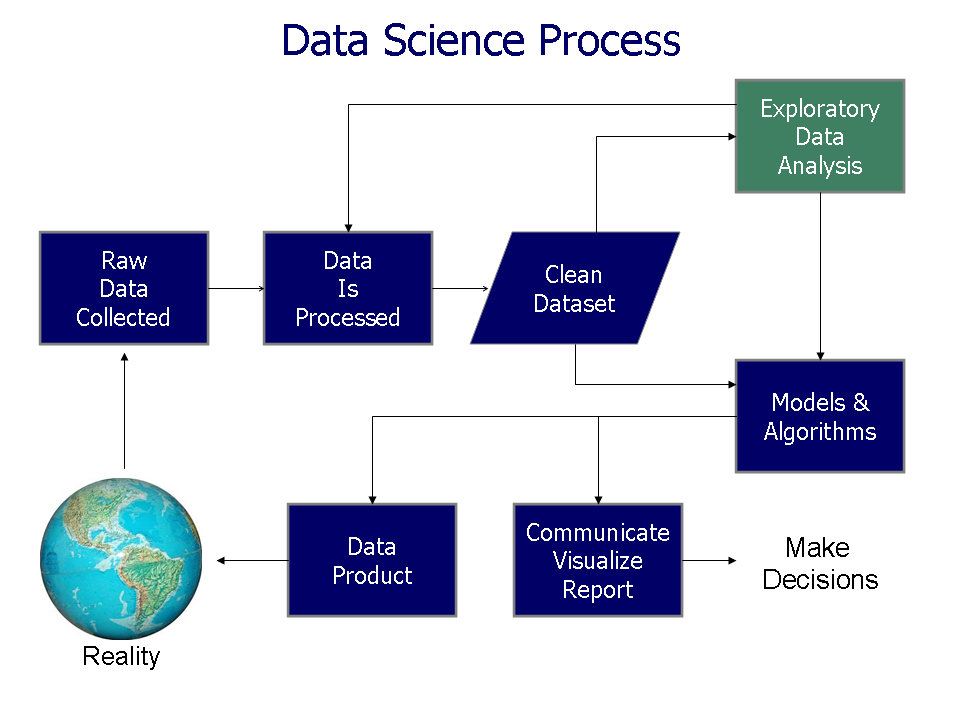
Source: Exploratory Data Analysis - wikipedia
Background Story
Imagine that you are expecting royal guests for dinner. You are asked to research a special menu from a cooking book with thousands of recipes. As they are very pretentious you need to avoid some ingredients or find exact quantities for others. Dinner and launch menus are needed.
Unfortunately some recipes are wrong and others are incomplete.
How to start? You may start with the main ingredients. Another option is by selecting the meal type and course. There should be a special menu for Vegetarians.
The story above reminds of Exploratory Data Analysis(EDA). All the steps and questions are part of understanding unknown territory. Let's try to solve this with Data Science.
What is Exploratory Data Analysis?
Exploratory data analysis is like detective work: searching for insights that identify problems and hidden patterns.
Start with one variable at a time, then explore two variables, and so on.
Exploratory Data Analysis(EDA) - analyze and investigate datasets and summarize their main characteristics and apply visualization methods.
Tools for EDA:
Most popular Tools:
- Pandas/Python
- R
Techniques for EDA:
Visual techniques
Dimensionality reduction
Exploratory Data Analysis - Example Project
Let's do an example on Exploratory Data Analysis using Food Recipes.
We will do step by step analysis on this data set and answer on questions like:
- What data do we have?
- What is the dimension of this data?
- Are there any dependent variables?
- What are the data types?
- Missing data?
- Duplicate data?
- Correlations?
You can find the notebook on and Google Colab:
- GitHub
- Google Colab - you can play with this notebook without installing Python
Step 1: Load Data and Initial Analysis
First we will import the needed libraries and then load the dataset into Pandas:
import pandas as pd
import seaborn as sns
import matplotlib.pyplot as plt

df = pd.read_csv('https://raw.githubusercontent.com/softhints/Pandas-Exercises-Projects/main/data/food_recipes.csv', low_memory=False)
Step 2: Initial Analysis of Pandas DataFrame
We will check the data by using the following methods:
df- returns first and last 5 records; returns number of rows and columnshead(n)- returns first n rowstail(n)- returns last n rowssample(n)- sample random n rows
The first 2 rows transposed looks like:
| 0 | 1 | |
|---|---|---|
| recipe_title | Roasted Peppers And Mushroom Tortilla Pizza Recipe | Thakkali Gotsu Recipe | Thakkali Curry | Spicy & Tangy Tomato Gravy |
| url | https://www.archanaskitchen.com/roasted-peppers-and-mushroom-tortilla-pizza-recipe | https://www.archanaskitchen.com/tomato-gotsu-recipe-spicy-tangy-tomato-gravy |
| record_health | good | good |
| vote_count | 434 | 3423 |
| rating | 4.958525 | 4.932223 |
| description | is a quicker version pizza ....: | also known as the is a ... |
| cuisine | Mexican | South Indian Recipes |
| course | Dinner | Lunch |
| diet | Vegetarian | Vegetarian |
| prep_time | 15 M | 10 M |
| cook_time | 15 M | 20 M |
| ingredients | Tortillas|Extra Virgin Olive Oil|Garlic|Mozzarella cheese|Red Yellow or Green Bell Pepper (Capsicum)|Onions|Kalmatta olives|Button mushrooms | Sesame (Gingelly) Oil|Mustard seeds (Rai/ Kadugu)|Curry leaves|Garlic|Pearl onions (Sambar Onions)|Tomatoes|Tamarind|Turmeric powder (Haldi)|Salt|Jaggery |
| instructions | To begin making the Roasted ... | To begin making Tomato Gotsu Recipe/ .... |
| author | Divya Shivaraman | Archana Doshi |
| tags | Party Food Recipes|Tea Party Recipes|Mushroom Recipes|Fusion Recipes|Tortilla Recipe|Bell Peppers Recipes | Vegetarian Recipes|Tomato Recipes|South Indian Recipes|Breakfast Recipe Ideas |
| category | Pizza Recipes | Indian Curry Recipes |
We are lucky with:
df.sample(2)
as we can see missing values and non latin symbols:
| recipe_title | url | record_health | vote_count | rating | description | cuisine | course | diet | prep_time | cook_time | ingredients | instructions | author | tags | category | |
|---|---|---|---|---|---|---|---|---|---|---|---|---|---|---|---|---|
| 2400 | Coconut Chia Pudding Recipe | https://www.archanaskitchen.com/coconut-chia-pudding-recipe | good | 162 | 4.975309 | Coconut Chia Pudding makes a great snack or even ... | NaN | NaN | NaN | NaN | NaN | Chia Seeds|Tender coconut water|Coconut milk|Orange|Blueberries|Pistachios|Honey|Mint Leaves (Pudina) | To begin making the Coconut Chia Pudding recipe... | Gauravi Vinay | Healthy Recipes|Breakfast Recipe Ideas|Pudding Recipes|Coconut Recipes | Dessert Recipes |
| 1447 | पंजाबी स्टाइल बूंदी कढ़ी रेसिपी - Punjabi Style Boondi Kadhi Recipe | https://www.archanaskitchen.com/punjabi-style-boondi-kadhi-recipe-in-hindi | good | 685 | 4.954745 | एक प्रसिद्ध कढ़ी है जिसे राजस्थान और पंजाब में बनाया जाता है. इसमें मेथी के दाने भी डाले जाते है ... | Punjabi | Side Dish | Vegetarian | 10 M | 30 M | दही|बेसन|हरी मिर्च|अदरक लहसुन का पेस्ट|लाल मिर्च पाउडर|हल्दी पाउडर|नमक|घी|लॉन्ग|पूरी काली मिर्च|जीरा|मेथी के दाने|हींग|बूंदी | पंजाबी स्टाइल बूंदी कढ़ी रेसिपी बनाने के लिए सबसे पहले एक बाउल में ... | Archana's Kitchen | Side Dish Recipes|Indian Lunch Recipes|Dahi Recipes (Curd/Yogurt)|Indian Dinner Recipes|Winter Recipes | Kadhi Recipes |
The initial findings for this dataset are:
Insights
- dataset has header column
- separator is ';'
NaNrepresents missing values- 2 columns with nested data - ingredients and tags
- if we take closer look we can find values divided by pipes - "|"
- for further analysis - data need to be normalized
- there are non latin characters in this dataset
Let's continue with the analysis and not rely on luck or first impressions.
Step 3: Dimension and data types of DataFrame
Next we will use several Pandas methods in order to find information for the columns, dimensions, nested data and more:
df.shape
will return the dimension of this dataset:
(8009, 16)
We can get columns by:
df.columns
Index(['recipe_title', 'url', 'record_health', 'vote_count', 'rating',
       'description', 'cuisine', 'course', 'diet', 'prep_time', 'cook_time',
       'ingredients', 'instructions', 'author', 'tags', 'category'],
      dtype='object')
To get information about the data types we can use:
df.info()
df.dtypes
which results into:
<class 'pandas.core.frame.DataFrame'>
RangeIndex: 8009 entries, 0 to 8008
Data columns (total 16 columns):
Column         Non-Null Count  Dtype
---  ------         --------------  -----
 0   recipe_title   8009 non-null   object
 1   url            8009 non-null   object
 2   record_health  8009 non-null   object
 3   vote_count     8009 non-null   int64
 4   rating         8009 non-null   float64
 5   description    7994 non-null   object
 6   cuisine        7943 non-null   object
 7   course         7854 non-null   object
 8   diet           7858 non-null   object
 9   prep_time      7979 non-null   object
 10  cook_time      7979 non-null   object
 11  ingredients    7997 non-null   object
 12  instructions   8009 non-null   object
 13  author         8009 non-null   object
 14  tags           7930 non-null   object
 15  category       8009 non-null   object
dtypes: float64(1), int64(1), object(14)
memory usage: 1001.2+ KB
The above gives use:
- 3 data types -
float64(1), int64(1), object(14) - memory usage: 1001.2+ KB
- information for the rows and the columns
By using the method df.shape() we can find the total number of rows and columns. Which has synonyms:
row- observation, record, trialcolumn- variable, feature, characteristic
Data insights from this step:
Insights:
- dataset contains - 8009 rows and 16 columns
- 8009 observations
- 16 characteristics
- 2 numeric columns
- 2 which need conversion - prep_time and cook_time
- convert string to int
- 15 M -> 15
Step 4: Statistics - min, max, mean, percentile
We can get useful statistics for numeric and non numeric columns of this DataFrame.
4.1. Descriptive statistics for numeric columns
For numeric columns we can use:
df.describe()
which returns stats like:
- mean
- standard deviation
- percentile
- count
- min and max
| vote_count | rating | |
|---|---|---|
| count | 8009.000000 | 8009.000000 |
| mean | 2268.004495 | 4.888621 |
| std | 3683.156570 | 0.077467 |
| min | 15.000000 | 3.175705 |
| 25% | 494.000000 | 4.865031 |
| 50% | 1050.000000 | 4.900553 |
| 75% | 2487.000000 | 4.930000 |
| max | 80628.000000 | 5.000000 |
Insights:
- mean value is close to 75%
- no missing values
- big difference between max and 75% percentile for
vote_count- potential outliers
4.2. Pandas describe() for non numeric columns
For the rest of the columns we can use include='object':
df.describe(include='object')
the result is:
| recipe_title | url | record_health | description | cuisine | course | diet | ingredients | |
|---|---|---|---|---|---|---|---|---|
| count | 8009 | 8009 | 8009 | 7994 | 7943 | 7854 | 7858 | 7997 |
| unique | 8009 | 8009 | 1 | 7989 | 77 | 13 | 10 | 7953 |
| top | Roasted Peppers And Mushroom Tortilla Pizza Recipe | https://www.archanaskitchen.com/roasted-peppers-and-mushroom-tortilla-pizza-recipe | good | If you like this recipe, try more recipes like | Indian | Lunch | Vegetarian | Lemons|Sugar|Salt|Red Chilli powder |
| freq | 1 | 1 | 8009 | 6 | 1336 | 1925 | 5478 | 3 |
Few columns seems to be more interesting than the rest:
Insights:
- 4 categorical columns -
category,cuisine,dietandcourse - 1 column with single value -
record_health
Step 5: Inspect single column of DataFrame
df.diet.nunique()
returns the number of unique values in this column:
10
df.diet.unique()
will give us all unique values:
array(['Vegetarian', 'High Protein Vegetarian', 'Non Vegeterian',
       'No Onion No Garlic (Sattvic)', 'High Protein Non Vegetarian',
       'Diabetic Friendly', 'Eggetarian', 'Vegan', 'Gluten Free', nan,
       'Sugar Free Diet'], dtype=object)
df.diet.value_counts(dropna=False)
returns the values and their frequency:
Vegetarian                      5478
High Protein Vegetarian          792
Non Vegeterian                   447
Eggetarian                       391
Diabetic Friendly                296
High Protein Non Vegetarian      225
NaN                              151
No Onion No Garlic (Sattvic)      77
Vegan                             71
Gluten Free                       66
Sugar Free Diet                   15
Name: diet, dtype: int64
Insights:
- 10 unique values
- categorical column
Vegetarian- is the most frequent value- 151 - missing values
Step 6: Data conversion in Pandas
Sometimes data needs to be processed for proper analysis. For example nested data to be expanded, string needs to be converted to number or date.
We'll see two examples of data processing required for further data analysis.
6.1 Convert String to numeric
To analyze columns cook_time and prep_time as numeric we can convert them by:
df['cook_time'] = df['cook_time'].str.replace(' M', '').fillna(0).astype(int)
df['prep_time'] = df['prep_time'].str.replace(' M', '').fillna(0).astype(int)
Now we can apply visual techniques to analyze those columns for outliers - this is done in section 7.3 of this article.
6.2 Expand nested column
Next we will expand a column "ingredients" - in order to analyze ingredients for each recipe:
df['ingredients'].str.split('|', expand=True)
The result is new DataFrame with expanded values from the ingredient column:
from:
0       Tortillas|Extra Virgin Olive Oil|Garlic|Mozzar...
1       Sesame (Gingelly) Oil|Mustard seeds (Rai/ Kadu...
2       Extra Virgin Olive Oil|Pineapple|White onion|R...
to:
| 0 | 1 | 2 | 3 | 4 | |
|---|---|---|---|---|---|
| 0 | Tortillas | Extra Virgin Olive Oil | Garlic | Mozzarella cheese | Red Yellow or Green Bell Pepper (Capsicum) |
| 1 | Sesame (Gingelly) Oil | Mustard seeds (Rai/ Kadugu) | Curry leaves | Garlic | Pearl onions (Sambar Onions) |
| 2 | Extra Virgin Olive Oil | Pineapple | White onion | Red Yellow and Green Bell Peppers (Capsicum) | Pickled Jalapenos |
| 3 | Arhar dal (Split Toor Dal) | Turmeric powder (Haldi) | Salt | Dry Red Chillies | Mustard seeds (Rai/ Kadugu) |
| 4 | Rajma (Large Kidney Beans) | Cashew nuts | Sultana Raisins | Asafoetida (hing) | Cumin seeds (Jeera) |
To find the most common 'ingredient' in the all recipes we can use the following steps:
- split the column on separator "|"
expand=True- will expand data to DataFrame
melt()- transform DataFrame columns to rows - pairs of variable and value- count the values by
.value_counts()
df['ingredients'].str.split('|', expand=True).melt()['value'].value_counts()
we found that salt is the most popular ingredient:
Salt                       5698
Sunflower Oil              2241
Garlic                     2227
Turmeric powder (Haldi)    2221
Onion                      2012
                           ...
नारीयल पानी                   1
नारीयल का दूध                 1
सिंघाड़े का आटा               1
Black currant (dried)         1
Corn chips                    1
Name: value, Length: 1823, dtype: int64
Step 7: Visualization for Data Analysis
Finally lets cover a few visualization techniques to find missing values, outliers and correlations.
7.1 Missing values
The first visualization technique is about finding missing values in Pandas DataFrame.
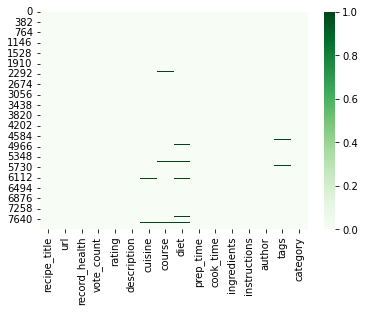
Use library Seaborn with heat map to plot missing values for the whole dataset:
df.isna()- returns new DataFrame with True/False values depending on the missing values in a cellcmap = 'Greens'- is a color map. For more info check: Get color palette with matplotlib
sns.heatmap(df.isna(),cmap = 'Greens')
result is:
Next let's check the same visualization for the last 3000 rows:
sns.heatmap(df.tail(3000).isna(),cmap = 'Greens')
result:
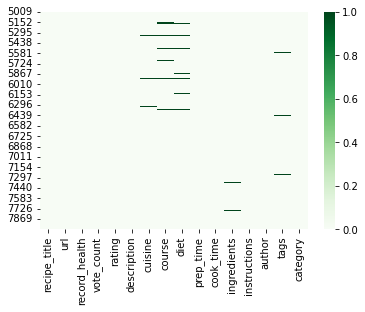
From the result above we can conclude:
Insights:
- data set has missing values in several columns
- represented by darker green lines
cuisine,courseanddiet- plot suggest pattern for missing values of those columns
7.2 Correlations
Again will use Seaborn's heatmap in order to visualize correlations between two and more columns:
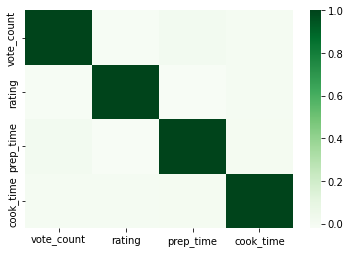
sns.heatmap(df.corr(),cmap='Greens',annot=False)
The first option is for the whole dataset shows - no correlation between the columns.
sns.heatmap(df[df.diet=='Vegan'].corr(),cmap='Greens',annot=True)
While the second one is showing correlations for rows with type "Vegan". We can see a correlation between columns 'prep_time' and 'cook_time'.
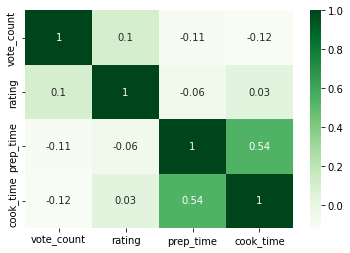
Insights:
- no correlation of numerical columns for the whole DataFrame
- correlation for - Vegan recipes - between
prep_timeandcook_time - darker color represent positive correlation
- lighter - negative
- to get values use
annot=True
7.3 Detect outliers in Pandas DataFrame
Finally we will use boxplot to detect outliers:
cols = ['vote_count', 'rating',  'prep_time', 'cook_time']
plt.figure(figsize=(20, 5))
sns.boxplot(data=df[cols], orient='h')
The picture below suggest about outliers in the numeric columns
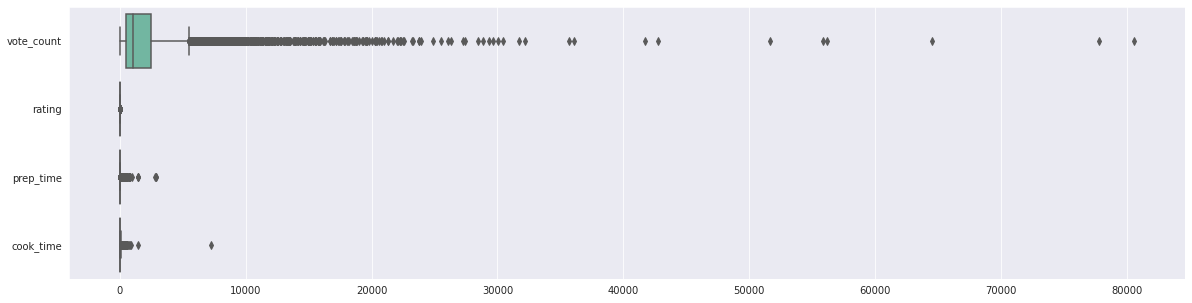
Insights:
vote_count- suggest outlierscook_time- has possible outliersrating- doesn't indicate outliers
7.4 Explain Seaborn boxplot and outliers
In order to get a better understanding we will work only with two columns: 'prep_time', 'cook_time' and the first 18 records.
The stats for them are:
df[['prep_time', 'cook_time']].head(18).describe()
| prep_time | cook_time | |
|---|---|---|
| count | 18.000000 | 18.000000 |
| mean | 12.222222 | 22.388889 |
| std | 4.608886 | 17.091928 |
| min | 5.000000 | 0.000000 |
| 25% | 10.000000 | 11.250000 |
| 50% | 10.000000 | 20.000000 |
| 75% | 15.000000 | 30.000000 |
| max | 20.000000 | 60.000000 |
The picture below illustrates how to analyze a dataset for outliers with boxplot.
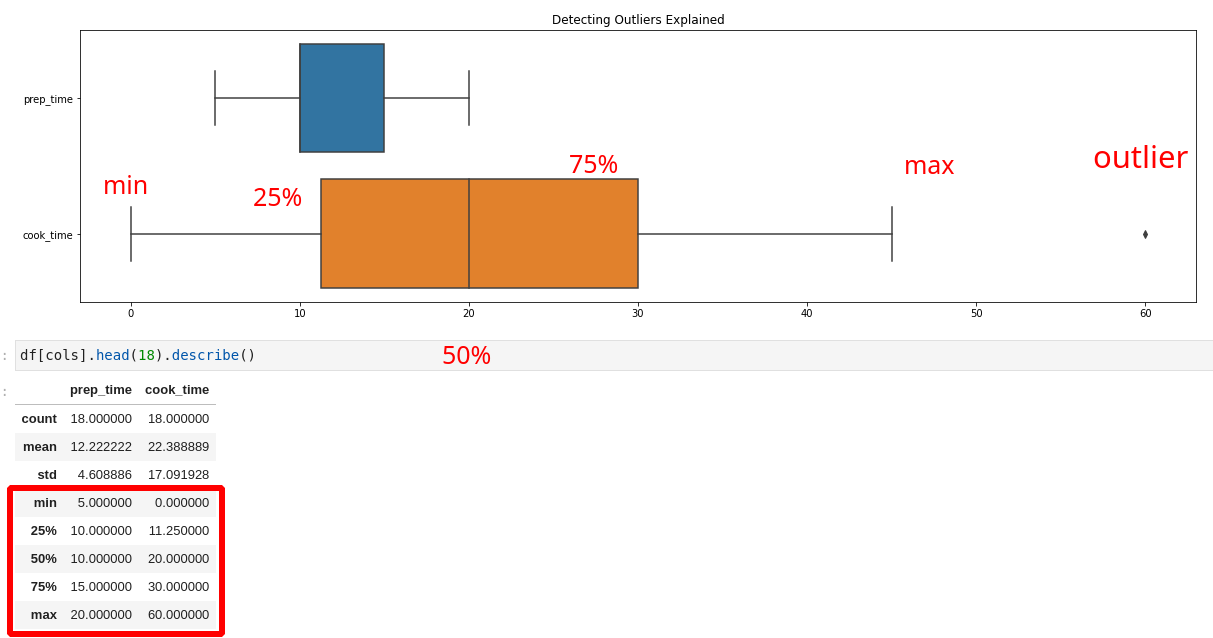
Boxplot has 3 main components:
- box (Interquartile Range - IQR)
- q1 - 25%
- q2 - 50% or median
- q3 - 75%
- whiskers
- min
- max
- outliers
- points beyond the whiskers
We can notice that sometimes the whiskers don't match the min/max. They are calculated based on formulas. Upper and low whiskers are calculated as 1.5 multiplied on the interquartile range - IQR(the box).
An outlier(extreme) is a value that lies in the extremes of a data Series(on either end). They can affect overall observation and insights.
In the next article we will cover more techniques and several Python libraries for exploratory data analysis.
Conclusion
In this article, we covered the basics of Exploratory Data Analysis and discussed most of the common methods which every data scientist should know while working with datasets. Through practical examples, we learned how to explore new datasets.
We started by initial data analysis and first glance of data. After that, we made data conversion and preprocessing for further analysis. Finally, we saw multiple visual techniques in order to find missing values, outliers and correlations.