


In this tutorial, we'll discuss the best libraries for Exploratory Data Analysis in Python.
We will cover these EDA libraries:
| Library | GitHub Stars | Contributors | Used by |
|---|---|---|---|
| pandas-profiling | 9700 | 79 | 9200 |
| D-Tale | 3700 | 22 | 501 |
| Sweetviz | 2200 | 5 | n/a |
| DataPrep | 1400 | 33 | n/a |
| AutoViz | 968 | 13 | 265 |
| dabl | 684 | 23 | n/a |
| klib | 331 | 8 | n/a |
1. Overview
Exploratory Data Analysis is a crucial step in the Data Science process.
It not only improves quality and consistency of the data, but it also reveals hidden trends and insights.
In this article we will use the following DataFrames:
import pandas as pd
file = 'https://raw.githubusercontent.com/softhints/Pandas-Exercises-Projects/main/data/food_recipes.csv'
df = pd.read_csv(file, low_memory=False)

file_m = 'https://raw.githubusercontent.com/softhints/Pandas-Exercises-Projects/main/data/movies_metadata.csv'
df_m = pd.read_csv(file_m, low_memory=False)
You can learn more by:
- opening the notebook from:
- watching video:
2. sweetviz - quick summary
SweetViz generates beautiful and detailed reports with visualizations.
The report is available as HTML output.
Resources
In-depth EDA (target analysis, comparison, feature analysis, correlation) in two lines of code!
pip install sweetviz
Features
- Target analysis
- Visualize and compare
- Mixed-type associations
- Type inference
- Summary information
Code
import sweetviz as sv

my_report = sv.analyze(df)
my_report.show_html()
We can get quick summary of data to find:
- trends
- missing values
- correlations
- categorical data
We can see a summary of the data types.
Then we can see the associations. There are 3 types of info depending on the column type:
- text
- numeric
- categorical
3. autoviz - visualization
As the name suggests it will automatically visualize datasets.
One difference to the first one is that:
- it will take file as an input
- so you need to provide file path and separator
- It's a bit slower than previous one
Reports are generated by using Bokeh as Jupyter output.
Resources
Automatically Visualize any dataset, any size with a single line of code. Now you can save these interactive charts as HTML files automatically with the "html" setting.
pip install autoviz
Features
- Visualize and compare
- Summary information
- Outliers and missing values
- Data cleaning improvement suggestions
Code
from autoviz.AutoViz_Class import AutoViz_Class

AV = AutoViz_Class()

#EDA using Autoviz
dft = AV.AutoViz( file, sep=",")
First we can see the summary. Number of unique values, missing ones and dtypes.
We know that: prep_time and cook_time are recognized as string columns. But they can be converted to numerical - by replacing ' M'.
This library offers - Data cleaning improvement suggestions. This is very useful for beginners.
We can see different plots depending on the dtype like:
- distribution plot
- box plot
- heatmaps
- bar plots for continuous data
- and finally word clouds for text data.
4. pandas-profiling - reports
pandas-profiling is the most popular and most used library according to Github. It has a big list of features and it's very fast.
There are 7 tabs in the final report.
Resources
pandas-profiling generates profile reports from a pandas DataFrame. pandas-profiling extends pandas DataFrame with df.profile_report(), which automatically generates a standardized univariate and multivariate report for data understanding.
pip install pandas-profiling
Features
- Type inference: detect the types of columns in a DataFrame
- Essentials: type, unique values, indication of missing values
- Quantile statistics: minimum value, Q1, median, Q3, maximum, range, interquartile range
- Descriptive statistics: mean, mode, standard deviation, sum, median absolute deviation, coefficient of variation, kurtosis, skewness
- Most frequent and extreme values
- Histograms: categorical and numerical
- Correlations: high correlation warnings, based on different correlation metrics (Spearman, Pearson, Kendall, Cramér’s V, Phik)
- Missing values: counts, matrix, heatmap and dendrograms
- Duplicate rows: list of the most common duplicated rows
- Text analysis: most common categories (uppercase, lowercase, separator), scripts (Latin, Cyrillic) and blocks (ASCII, Cyrilic)
- File and Image analysis:
Code
from pandas_profiling import ProfileReport

profile = ProfileReport(df, explorative=True)
profile
Overview
In first Tab we can see
- overview of data.
- alerts
- info for the analysis
Variables
- depending on the column type we see different information
- we can get more details by toggle
- URL analysis
- pretty useful feature
- netlocs
- schema
- text data
- min and max length
- most common words
- lower case data
- line breaks etc
- language detection
- most frequent char per script
- numeric
- stats like: 0-s, negative values, mean, max etc
- histogram
- common values
extreme values / possible outliers
- URL analysis
Interactions
We can find relation between different numeric columns
Correlations
There are several methods to get Correlations. We can get a description for each method by clicking on toggle.
Missing values
Missing values can be found in several different ways:
- count of null values
- matrix
- heatmap
- dendrogram
There is information below each graph.
Sample
In final tab we can see samples from the start and the end of this dataframe
5. dataprep - simple EDA
dataprep is advertised as:
The easiest way to prepare data in Python.
Some functionalities of DataPrep are inspired by Pandas Profiling.
It generates a beautiful profile report from a DataFrame with the create_report function. Works with Pandas and Dask.
Resources
DataPrep lets you prepare your data using a single library with a few lines of code.
pip install -U dataprep
Features
- Collect data from common data sources (through dataprep.connector)
- Do your exploratory data analysis (through dataprep.eda)
- Clean and standardize data (through dataprep.clean)
Code
from dataprep.datasets import load_dataset
from dataprep.eda import create_report

# df = load_dataset("titanic")
create_report(df).show_browser()
Advantages of this library are:
- it's very fast due to highly optimized Dask-based computing module
- supports big data
- 140+ functions designed for cleaning and validating data
- clean_country
- validate_country
- plot_correlation
- plot_missing
To list dataprep functions we can use next code snippets:
from dataprep.eda import __all__
print(__all__)
which results into:
['plot_correlation', 'compute_correlation', 'render_correlation', 'compute_missing', 'render_missing', 'plot_missing', 'plot', 'compute', 'render', 'DType', 'Categorical', 'Nominal', 'Ordinal', 'Numerical', 'Continuous', 'Discrete', 'DateTime', 'Text', 'create_report', 'create_db_report', 'create_diff_report', 'plot_diff', 'compute_diff', 'render_diff']
and
from dataprep.clean import __all__
print(__all__)
To get:
['clean_lat_long', 'validate_lat_long', 'clean_email', 'validate_email', 'clean_country', 'validate_country', 'clean_url', 'validate_url', 'clean_phone', 'validate_phone', 'clean_json', 'validate_json', 'clean_ip', 'validate_ip', 'clean_headers', 'clean_address', 'validate_address', 'clean_date', 'validate_date',
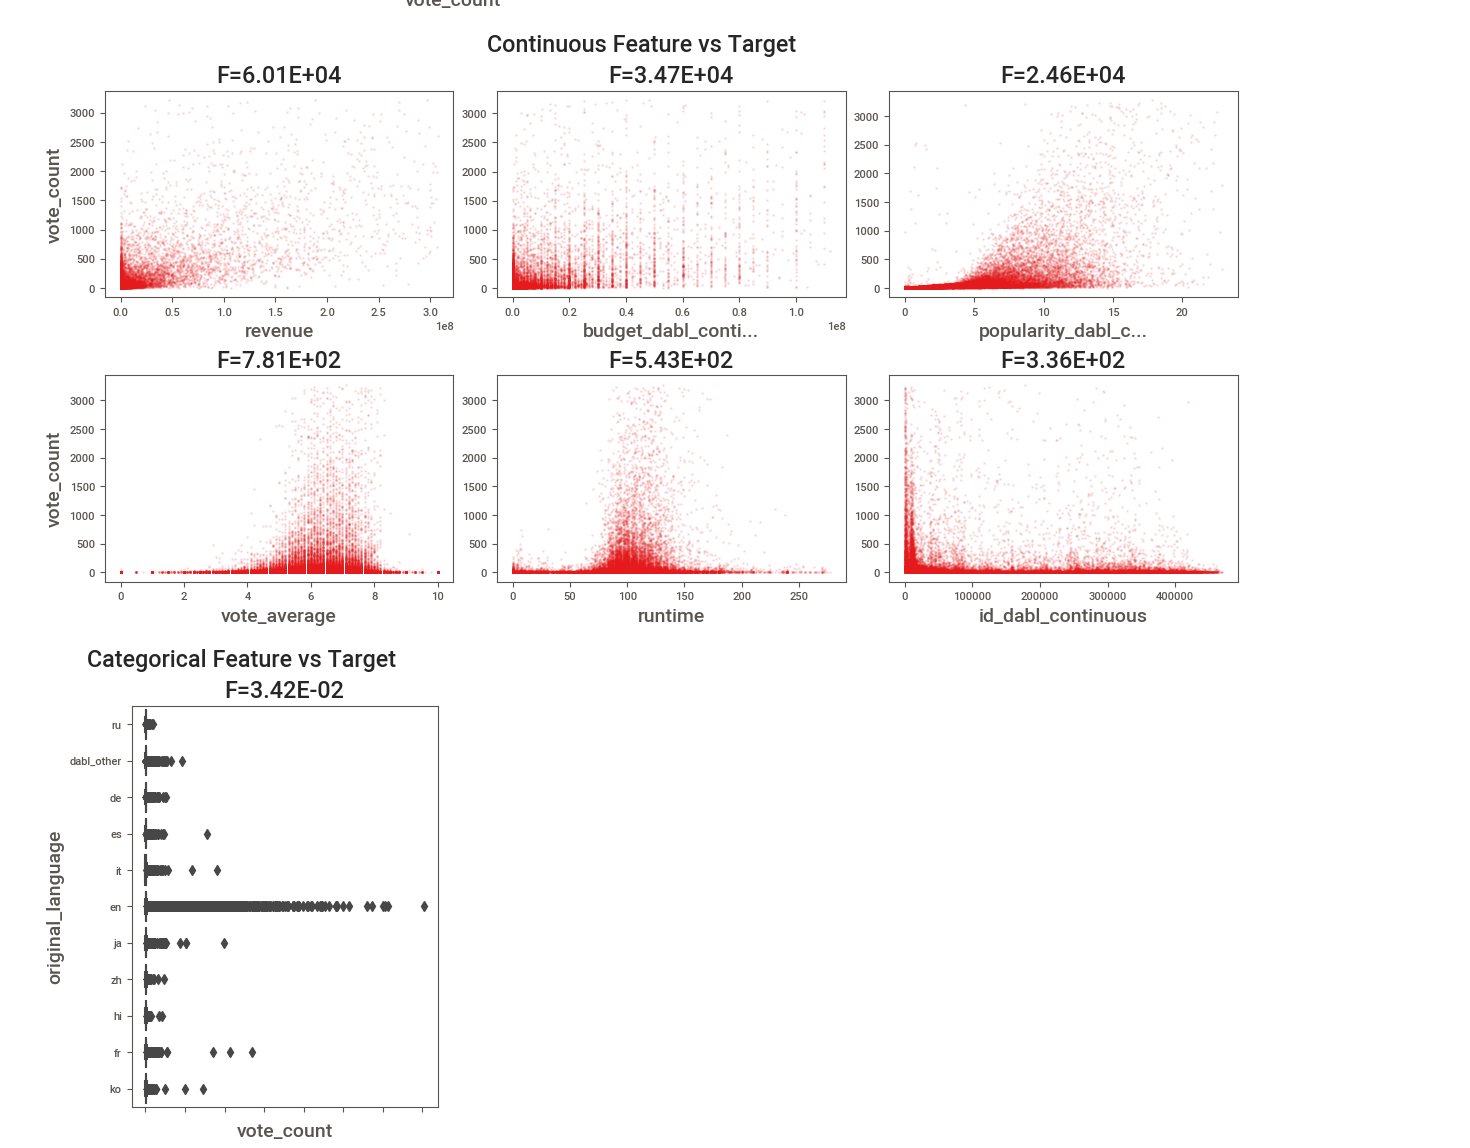
6. dabl - single column
Dabl focuses less on statistical measures of individual columns, and more on providing a quick overview via visualizations, as well as convenient preprocessing.
It's actively developed and not recommended for production.
The goal of dabl is to provide handy tool for beginners which build machine learning modules.
Resources
Data Analysis Baseline Library.
pip install dabl
Features
- Analyze single columns
- Grouped univariate histograms
- Scatter plot for categories
- Determine a good grid shape for subplots
- Create a mosaic plot from a dataframe
- Plots for categorical features in classification
- Visualize coefficients of a linear model
Code
import dabl

dabl.plot(df, target_col="rating")
7. dtale - interactive
D-Tale combines Flask back-end and a React front-end to bring an easy way to view & analyze Pandas data structures.
It's interactive and works with JupyterNotebook and JupyterLab.
Currently this tool supports such Pandas objects as DataFrame, Series, MultiIndex.
Data Analysis Baseline Library.
pip install dtale
Features
- Summarize Data
- Duplicates detection
- Missing Analysis
- Outlier Detection
- Custom Filter
- Network Viewer
- Correlations
- Predictive Power Score
- Heat Map
- Load Data & Sample Datasets
Code
import dtale
import pandas as pd

dtale.show(df)
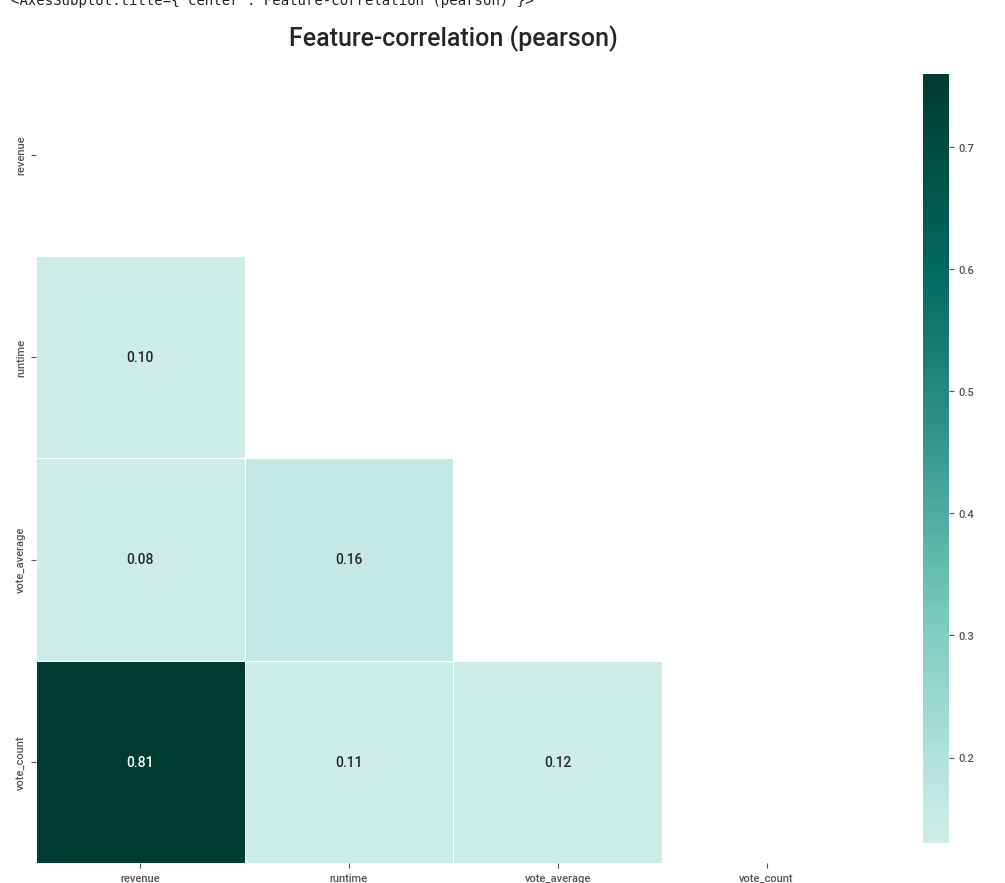
8. klib - rich features
klib is a library for importing, cleaning, analyzing and preprocessing data. Functions are divided in two areas:
- describe
- clean
Customized data preprocessing functions for frequent tasks..
pip install klib
Features
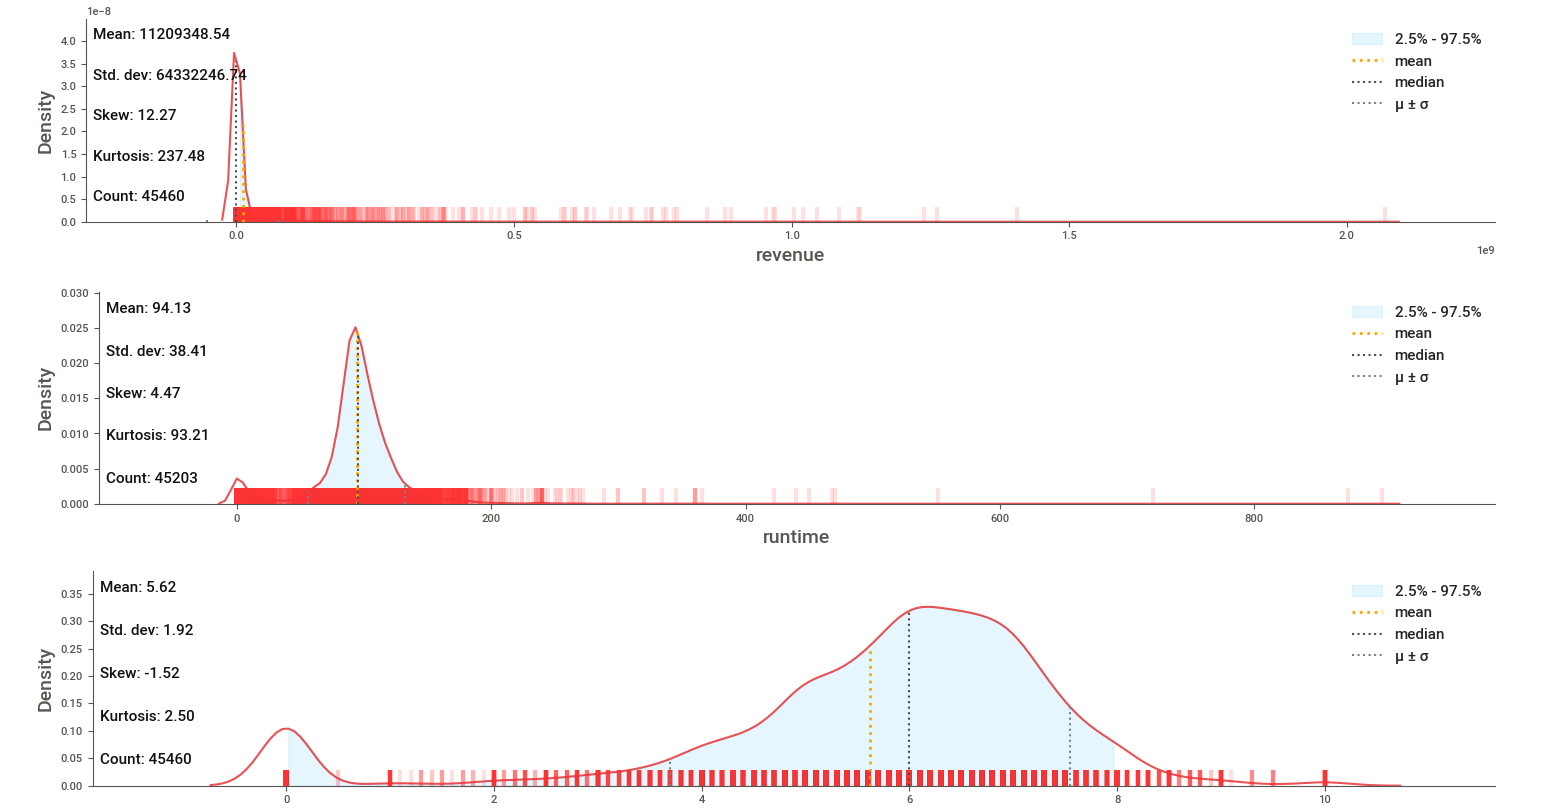
klib.describe - functions for visualizing datasets
klib.cat_plot(df)- returns a visualization of the number and frequency of categorical featuresklib.corr_mat(df)- returns a color-encoded correlation matrixklib.corr_plot(df)- returns a color-encoded heatmap, ideal for correlationsklib.dist_plot(df)- returns a distribution plot for every numeric featureklib.missingval_plot(df)- returns a figure containing information about missing values
klib.clean - functions for cleaning datasets
klib.data_cleaning(df)- performs data cleaning (drop duplicates & empty rows/cols, adjust dtypes,...)klib.clean_column_names(df)- cleans and standardizes column names, also called inside data_cleaning()klib.convert_datatypes(df)- converts existing to more efficient dtypes, also called inside data_cleaning()klib.drop_missing(df)- drops missing values, also called in data_cleaning()klib.mv_col_handling(df)- drops features with high ratio of missing values based on informational contentklib.pool_duplicate_subsets(df)- pools subset of cols based on duplicates with min. loss of information
Code
import klib

klib.missingval_plot(df_m)
df_cleaned = klib.data_cleaning(df_m)
klib.corr_plot(df_m)
klib.corr_plot(df_cleaned, target='revenue')
klib.dist_plot(df_m)
klib.corr_mat(df_cleaned)
9. Conclusion
In this article, we explored some of the best libraries of Exploratory Data Analysis and their features in the Python ecosystem.
Using best libraries can help in many aspects of data science process:
- speed up data science projects
- make the optimal decisions
- clean errors and confusion
If you like to learn more about data exploration process please check previous article: Exploratory Data Analysis Python and Pandas with Examples