To group by multiple columns in Pandas DataFrame can we use the method groupby()?
We will cover:
- group by multiple columns
- group by several statistical functions
- named group by
- Series vs DataFrame group by
To group by multiple columns and using several statistical functions we are going to use next functions:
groupby()agg()'mean', 'count', 'sum'
df.groupby(['publication', 'date_m']).agg(['mean', 'count', 'sum'])
Let's see all the steps in order to find the statistics for each group.
Step 1: Create sample DataFrame
Let's use the following Kaggle Dataset:
| title | date | publication | url |
|---|---|---|---|
| A Round of Applause for Algorithms | 2019-02-18 | Towards Data Science | https://towardsdatascience.com/a-round-of-applause-for-algorithms-3322f6aa1f8e |
| The Power of Thank-You Notes: A Simple Way to Make Your Team Happier (And More Productive) | 2019-10-21 | The Startup | https://medium.com/swlh/the-power-of-thank-you-notes-a-simple-way-to-make-your-team-happier-and-more-productive-fc6f2a575de2 |
| The Struggle of Modern Day Intrusion Detection Systems | 2019-09-17 | Towards Data Science | https://towardsdatascience.com/the-struggle-of-modern-day-intrusion-detection-systems-50481a6b53c6 |
| A Meditation on Stringing Words Together: The National’s “Roman Holiday” | 2019-05-22 | The Startup | https://medium.com/swlh/a-meditation-on-stringing-words-together-the-nationals-roman-holiday-7acbfef7cc02 |
| A Sense of Purpose Enables Better Human-Robot Collaboration | 2019-10-14 | Towards Data Science | https://towardsdatascience.com/a-sense-of-purpose-enables-better-human-robot-collaboration-fbe64d0ae913 |
You can find the sample data from the repository of the notebook or use the link below to download it.
To learn more about reading Kaggle data with Python and Pandas: How to Search and Download Kaggle Dataset to Pandas DataFrame
Step 2: Group by multiple columns
First lets see how to group by a single column in a Pandas DataFrame you can use the next syntax:
df.groupby(['publication'])
In order to group by multiple columns we need to give a list of the columns.
Group by two columns in Pandas:
df.groupby(['publication', 'date_m'])
The columns and aggregation functions should be provided as a list to the groupby method.
Step 3: GroupBy SeriesGroupBy vs DataFrameGroupBy
The object returned after the groupby of multiple columns depends on the usage of the groups. Let's check it by examples:
df.groupby('publication')
returns:
pandas.core.groupby.generic.DataFrameGroupBy
df.groupby(['publication'])['url']
returns:
pandas.core.groupby.generic.SeriesGroupBy
df.groupby(['publication'])[['url', 'date']]
returns:
pandas.core.groupby.generic.DataFrameGroupBy
If you use a single column after the groupby you will get SeriesGroupBy otherwise you will have DataFrameGroupBy.
Step 4: Apply multiple statistical functions
Applying multiple aggregation functions to a groupby is done by method: agg.
Note: that another function aggregate exists which and agg is an alias for it.
The functions can be passed as a list.
The available aggregation functions for group by in Pandas are:
count– non-null valuesmin/ `max – minimum/maximumstd– standard deviationsum– sum of valuesmean/median– mean/medianmodevar
Below you can find the syntax in order to apply multiple statistical functions on multiple pandas columns while grouping by multiple columns:
df.groupby(['publication', 'date_m'])[['claps', 'reading_time']].agg(['mean', 'count', 'sum'])
result:
| claps | reading_time | ||||||
|---|---|---|---|---|---|---|---|
| mean | count | sum | mean | count | sum | ||
| publication | date_m | ||||||
| Better Humans | 2019-03 | 1710.800000 | 5 | 8554 | 12.000000 | 5 | 60 |
| 2019-04 | 3942.250000 | 4 | 15769 | 7.500000 | 4 | 30 | |
| 2019-05 | 1187.000000 | 4 | 4748 | 25.000000 | 4 | 100 | |
| 2019-06 | 9700.000000 | 1 | 9700 | 5.000000 | 1 | 5 | |
| 2019-07 | 1183.333333 | 3 | 3550 | 22.333333 | 3 | 67 | |
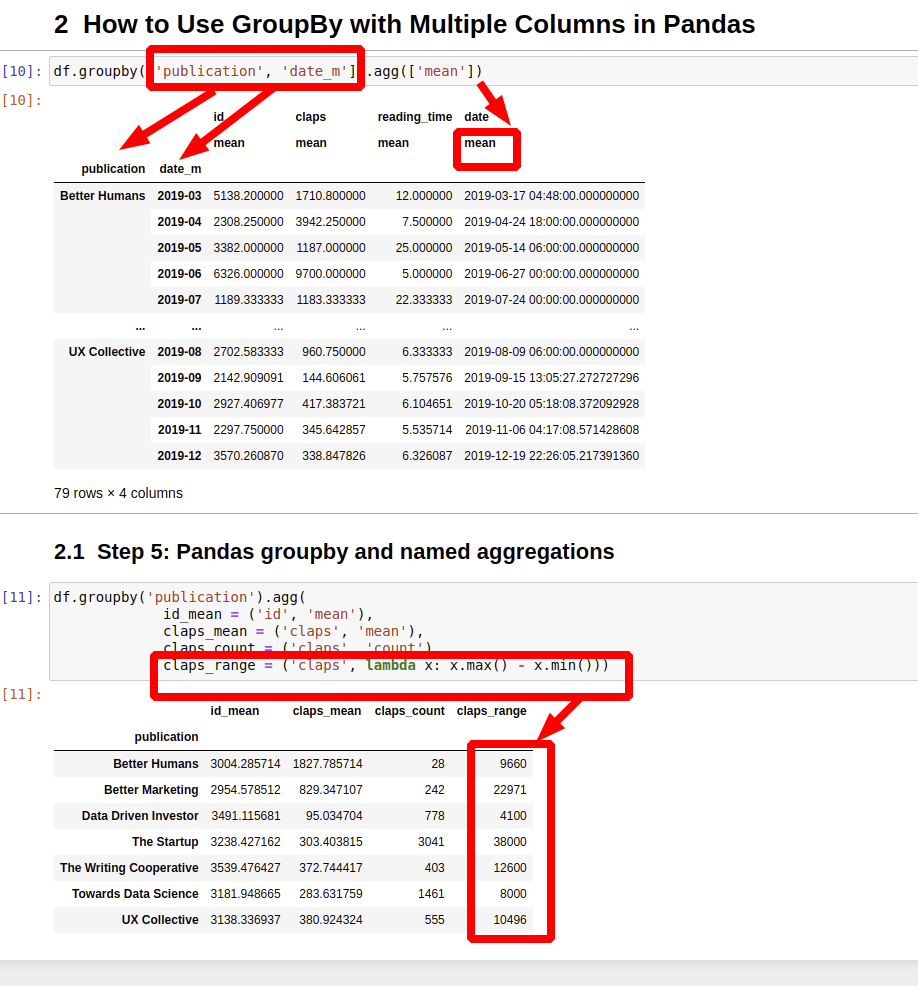
If you don't provide columns after the grouper than all numeric/datetime columns will be returned:
df.groupby(['publication', 'date_m']).agg(['mean'])
all columns on which agg functions can be applied are returned:
| id | claps | reading_time | date | ||
|---|---|---|---|---|---|
| mean | mean | mean | mean | ||
| publication | date_m | ||||
| Better Humans | 2019-03 | 5138.200000 | 1710.800000 | 12.000000 | 2019-03-17 04:48:00 |
| 2019-04 | 2308.250000 | 3942.250000 | 7.500000 | 2019-04-24 18:00:00 | |
| 2019-05 | 3382.000000 | 1187.000000 | 25.000000 | 2019-05-14 06:00:00 | |
| 2019-06 | 6326.000000 | 9700.000000 | 5.000000 | 2019-06-27 00:00:00 | |
| 2019-07 | 1189.333333 | 1183.333333 | 22.333333 | 2019-07-24 00:00:00 |
Note that the above results have MultiIndex. In order to work with MultiIndex you can check those articles:

Step 5: Pandas groupby and named aggregations
What if you like to group by multiple columns with several aggregation functions and would like to have - named aggregations.
In other words you need to get the next information:
id- mean of this columnclaps-mean,countandrange
You can also name the columns to meet your needs. Finally you can get them without MultiIndex. This is possible by next syntax:
df.groupby('publication').agg(
             id_mean = ('id', 'mean'),
             claps_mean = ('claps', 'mean'),
             claps_count = ('claps', 'count'),
             claps_range = ('claps', lambda x: x.max() - x.min()))
this will return:
| id_mean | claps_mean | claps_count | claps_range | |
|---|---|---|---|---|
| publication | ||||
| Better Humans | 3004.285714 | 1827.785714 | 28 | 9660 |
| Better Marketing | 2954.578512 | 829.347107 | 242 | 22971 |
| Data Driven Investor | 3491.115681 | 95.034704 | 778 | 4100 |
| The Startup | 3238.427162 | 303.403815 | 3041 | 38000 |
| The Writing Cooperative | 3539.476427 | 372.744417 | 403 | 12600 |
Conclusion
In this article we saw** how to group by multiple columns in Pandas.**
We saw how to group by two columns and use different aggregation functions in Pandas DataFrame.


