In this guide, we'll show how to render Pandas DataFrame as a HTML table while keeping the style.
We will cover striped tables and custom CSS formatting for Pandas DataFrames.
If you like to find more advanced Pandas styling check:
- Pandas Visualization & Styling
- How to Set Pandas DataFrame Background Color Based On Condition/Value or Alternate Row Color based on Group
Step 1: Create DataFrame
For this post we are going to use DataFrame with random generated integers.
df = pd.DataFrame({'a': {0: 3, 1: 3, 2: 4, 3: 0, 4: 0},
 'b': {0: 4, 1: 1, 2: 4, 3: 0, 4: 1},
 'c': {0: 0, 1: 2, 2: 3, 3: 0, 4: 0},
 'd': {0: 1, 1: 3, 2: 4, 3: 1, 4: 1},
 'e': {0: 2, 1: 0, 2: 3, 3: 1, 4: 0},
 'f': {0: 4, 1: 2, 2: 4, 3: 0, 4: 0},
 'g': {0: 3, 1: 1, 2: 2, 3: 4, 4: 0}})
result:
| a | b | c | d | e | f | g | |
|---|---|---|---|---|---|---|---|
| 0 | 3 | 4 | 0 | 1 | 2 | 4 | 3 |
| 1 | 3 | 1 | 2 | 3 | 0 | 2 | 1 |
| 2 | 4 | 4 | 3 | 4 | 3 | 4 | 2 |
| 3 | 0 | 0 | 0 | 1 | 1 | 0 | 4 |
| 4 | 0 | 1 | 0 | 1 | 0 | 0 | 0 |
Step 2: Convert Dataframe to HTML table
In order to Convert Dataframe to HTML table we are going to use method - to_html:
print(df.to_html())
which will result in:
<table border="1" class="dataframe">
  <thead>
    <tr style="text-align: right;">
      <th></th>
This will generate pretty basic HTML table without any formatting.
Step 3: Pandas DataFrame as striped table
If you like to get striped table from DataFrame(similar to the Jupyterlab formatting with alternate row colors then you can use Pandas method to_html and set classes - table table-striped:
print(df.to_html(classes='table table-striped text-center', justify='center'))
The generated HTML will require Bootstrap in order to visualize the table properly. Bootstrap can be add to your site by CDN Bootstrap Getting started:
-
In the
section of your site add:
<link rel="stylesheet" href="https://maxcdn.bootstrapcdn.com/bootstrap/3.3.2/css/bootstrap.min.css"> -
In the
section of your site at the bottom add:
<script src="https://maxcdn.bootstrapcdn.com/bootstrap/3.3.2/js/bootstrap.min.js"></script>
Step 4: Render DataFrame to HTML table keeping custom CSS style
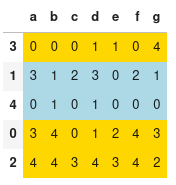
Finally let apply custom styling and convert the DataFrame as HTML table. So any style applied to Pandas DataFrame can be saved as HTML code. This can be done with method render as follows:
def format_color_groups(df):
    colors = ['gold', 'lightblue']
    x = df.copy()
    factors = list(x['b'].unique())
    i = 0
    for factor in factors:
        style = f'background-color: {colors[i]}'
        x.loc[x['b'] == factor, :] = style
        i = not i
    return x


df.sort_values(by='b').style.apply(format_color_groups, axis=None)
which will result in:

| a | b | c | d | e | f | g | |
|---|---|---|---|---|---|---|---|
| 0 | 3 | 4 | 0 | 1 | 2 | 4 | 3 |
| 1 | 3 | 1 | 2 | 3 | 0 | 2 | 1 |
| 2 | 4 | 4 | 3 | 4 | 3 | 4 | 2 |
| 3 | 0 | 0 | 0 | 1 | 1 | 0 | 4 |
| 4 | 0 | 1 | 0 | 1 | 0 | 0 | 0 |


