


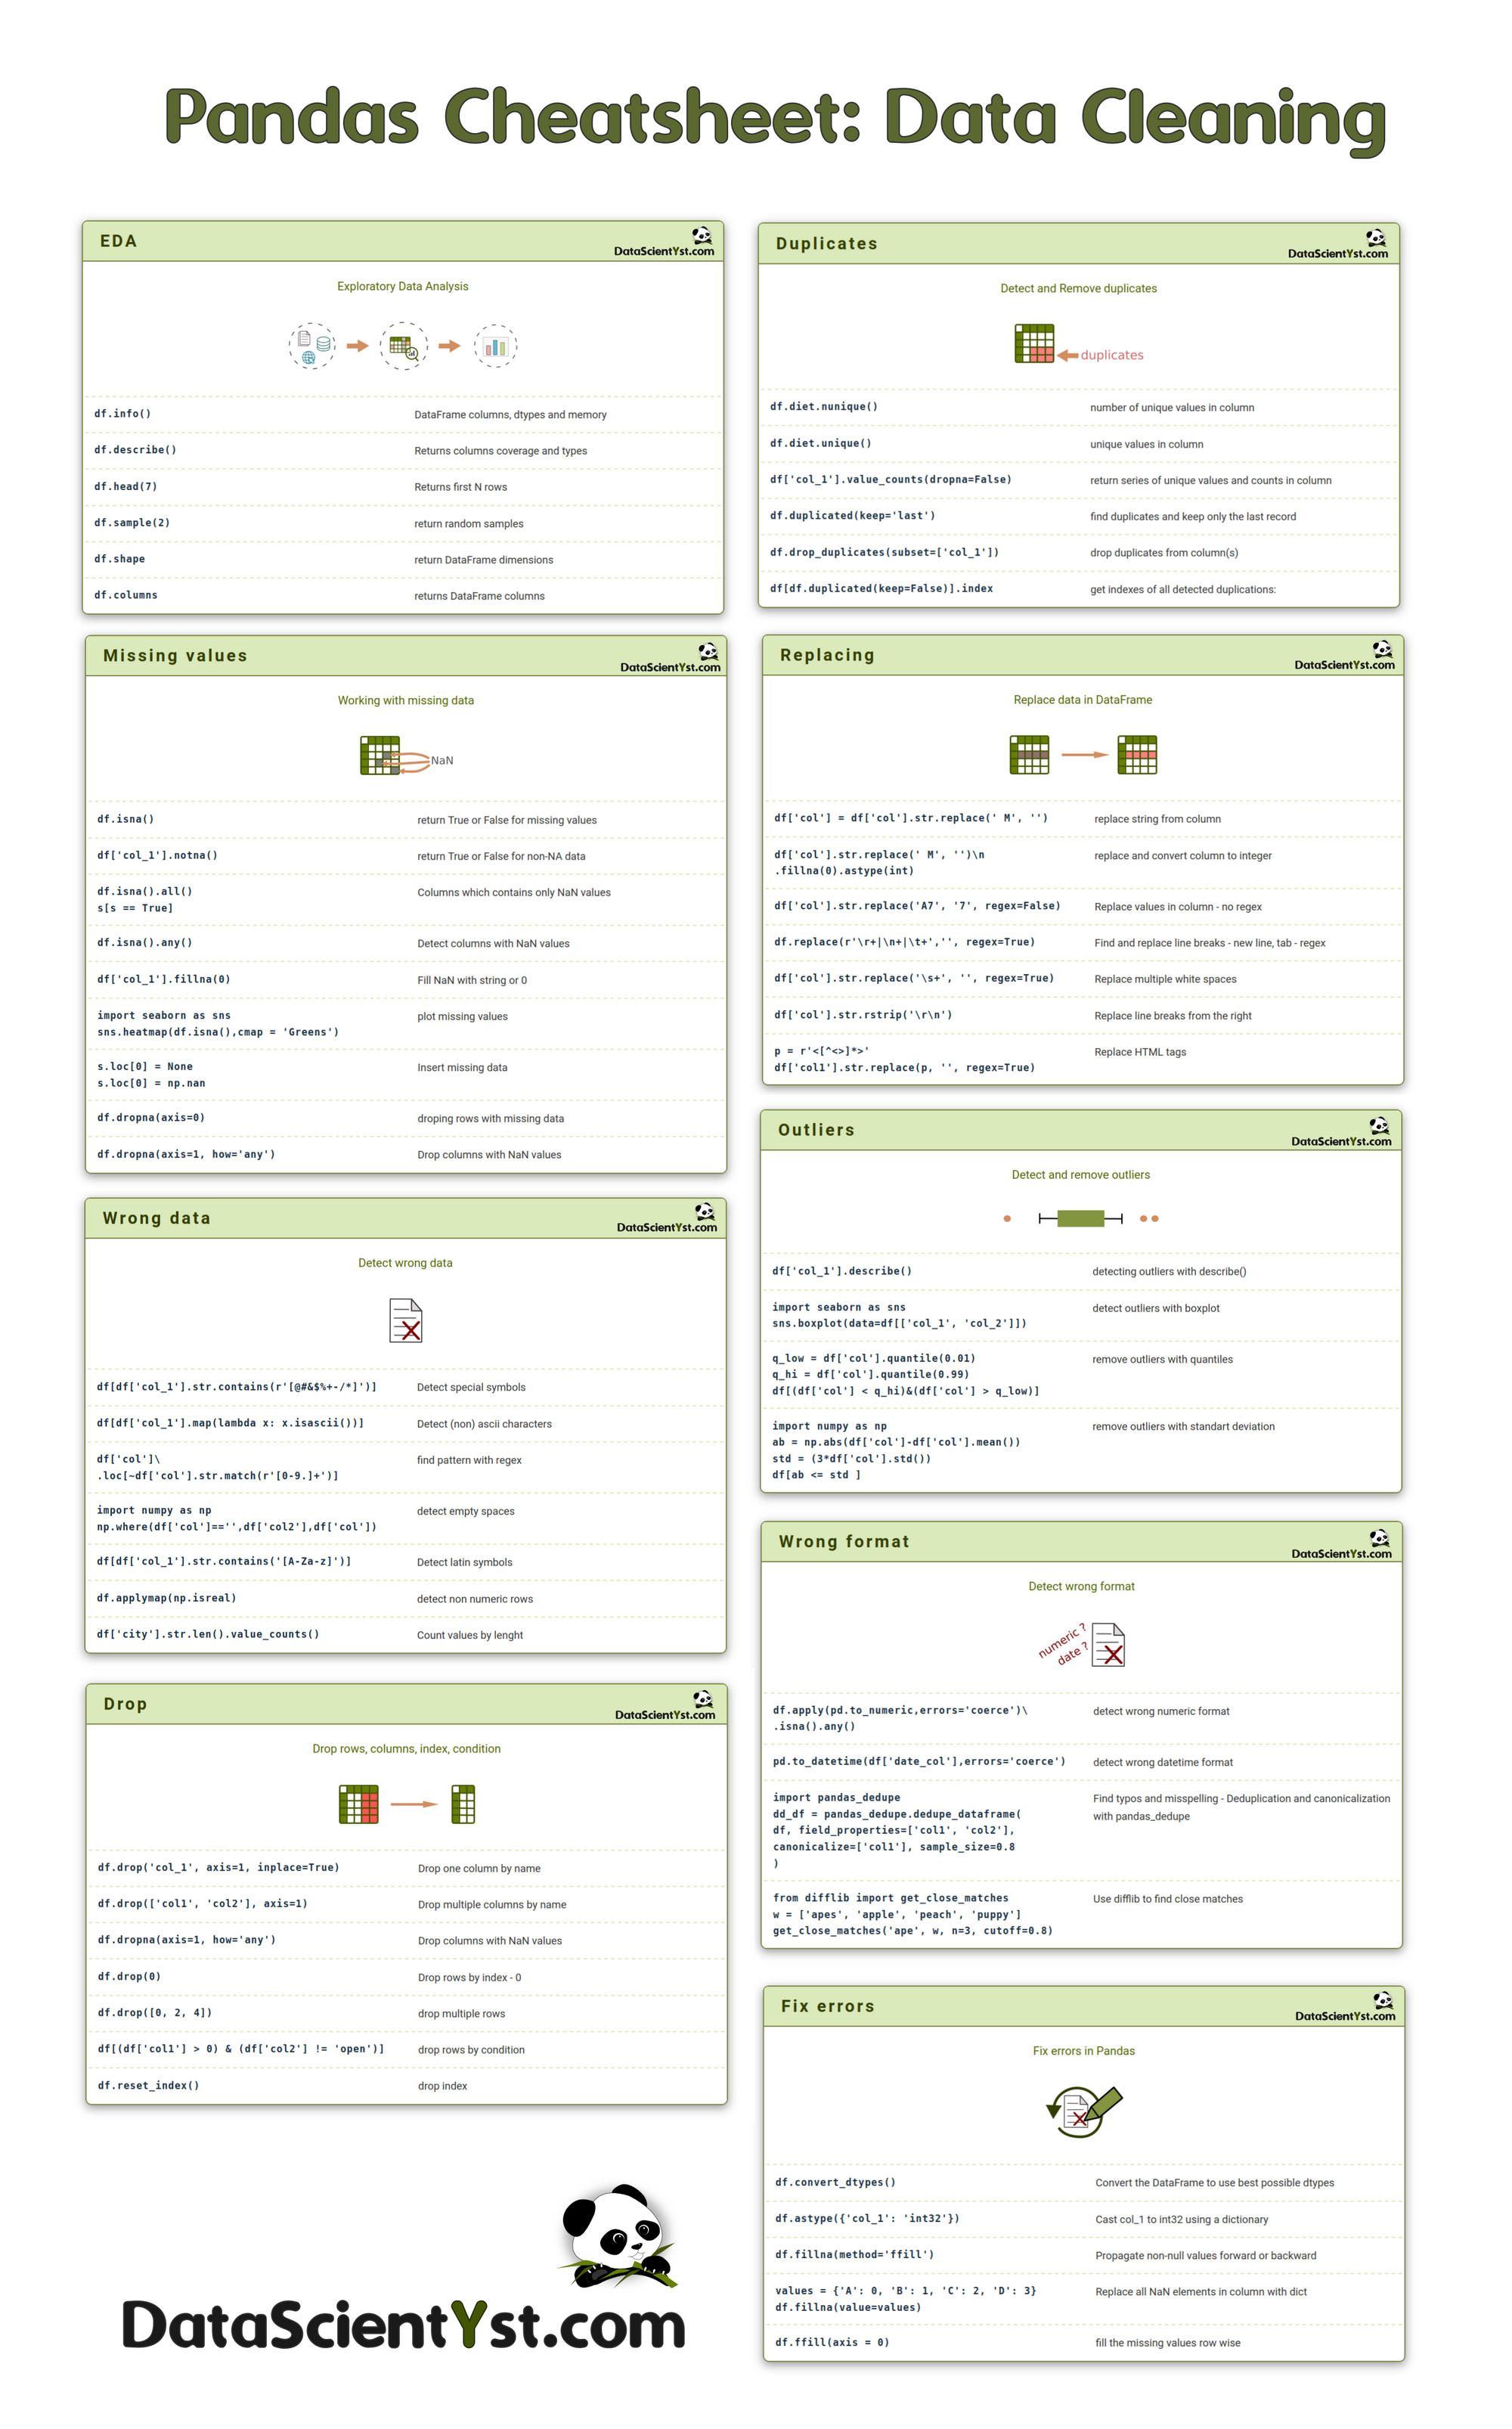
A practical Pandas Cheat Sheet: Data Cleaning useful for everyday working with data. This Pandas cheat sheet contains ready-to-use codes and steps for data cleaning.
The cheat sheet aggregate the most common operations used in Pandas for: analyzing, fixing, removing - incorrect, duplicate or wrong data.
This cheat sheet will act as a guide for data science beginners and help them with various fundamentals of data cleaning. Experienced users can use it as a quick reference.
- Data Cleaning Steps with Python and Pandas
- Data Cleaning - Kaggle course
- Working with missing data - Pandas Docs
- Data Cleaning Steps - kaggle
EDA
Exploratory Data Analysis

df.info()DataFrame columns, dtypes and memory
df.describe()Returns columns coverage and types
df.head(7)Returns first N rows
df.sample(2)return random samples
df.shapereturn DataFrame dimensions
df.columnsreturns DataFrame columns
Duplicates
Detect and Remove duplicates

df.diet.nunique()number of unique values in column
df.diet.unique()unique values in column
df['col_1'].value_counts(dropna=False)return series of unique values and counts in column
df.duplicated(keep='last')find duplicates and keep only the last record
df.drop_duplicates(subset=['col_1'])drop duplicates from column(s)
df[df.duplicated(keep=False)].indexget indexes of all detected duplications:
Missing values
Working with missing data

df.isna()return True or False for missing values
df['col_1'].notna()return True or False for non-NA data
df.isna().all()
s[s == True]
Columns which contains only NaN values
df.isna().any()Detect columns with NaN values
df['col_1'].fillna(0)Fill NaN with string or 0
import seaborn as sns
sns.heatmap(df.isna(),cmap = 'Greens')
plot missing values
s.loc[0] = None
s.loc[0] = np.nan
Insert missing data
df.dropna(axis=0)droping rows with missing data
df.dropna(axis=1, how='any')Drop columns with NaN values
Outliers
Detect and remove outliers

df['col_1'].describe()detecting outliers with describe()
import seaborn as sns
sns.boxplot(data=df[['col_1', 'col_2']])
detect outliers with boxplot
q_low = df['col'].quantile(0.01)
q_hi  = df['col'].quantile(0.99)
df[(df['col'] < q_hi)&(df['col'] > q_low)]
remove outliers with quantiles
import numpy as np
ab = np.abs(df['col']-df['col'].mean())
std = (3*df['col'].std())
df[ab <= std ]
remove outliers with standart deviation
Wrong data
Detect wrong data

df[df['col_1'].str.contains(r'[@#&$%+-/*]')]Detect special symbols
df[df['col_1'].map(lambda x: x.isascii())]Detect (non) ascii characters
df['col']\
    .loc[~df['col'].str.match(r'[0-9.]+')]
find pattern with regex
import numpy as np
np.where(df['col']=='',df['col2'],df['col'])
detect empty spaces
df[df['col_1'].str.contains('[A-Za-z]')]Detect latin symbols
df.applymap(np.isreal)detect non numeric rows
df['city'].str.len().value_counts()Count values by lenght
Wrong format
Detect wrong format

df.apply(pd.to_numeric,errors='coerce')\
    .isna().any()
detect wrong numeric format
pd.to_datetime(df['date_col'],errors='coerce')detect wrong datetime format
import pandas_dedupe
dd_df = pandas_dedupe.dedupe_dataframe(
    df, field_properties=['col1', 'col2'],
    canonicalize=['col1'], sample_size=0.8
)
Find typos and misspelling - Deduplication and canonicalization with pandas_dedupe
from difflib import get_close_matches
w =  ['apes', 'apple', 'peach', 'puppy']
get_close_matches('ape', w, n=3, cutoff=0.8)
Use difflib to find close matches
Fix errors
Fix errors in Pandas

df.convert_dtypes()Convert the DataFrame to use best possible dtypes
df.astype({'col_1': 'int32'})Cast col_1 to int32 using a dictionary
df.fillna(method='ffill')Propagate non-null values forward or backward
values = {'A': 0, 'B': 1, 'C': 2, 'D': 3}
df.fillna(value=values)
Replace all NaN elements in column with dict
df.ffill(axis = 0)fill the missing values row wise
Replacing
Replace data in DataFrame

df['col'] = df['col'].str.replace(' M', '')replace string from column
df['col'].str.replace(' M', '')\
    .fillna(0).astype(int)
replace and convert column to integer
df['col'].str.replace('A7', '7', regex=False)Replace values in column - no regex
df.replace(r'\r+|\n+|\t+','', regex=True)Find and replace line breaks - new line, tab - regex
df['col'].str.replace('\s+', '', regex=True)Replace multiple white spaces
df['col'].str.rstrip('\r\n')Replace line breaks from the right
p = r'<[^<>]*>'
df['col1'].str.replace(p, '', regex=True)
Replace HTML tags
Drop
Drop rows, columns, index, condition

df.drop('col_1', axis=1, inplace=True)Drop one column by name
df.drop(['col1', 'col2'], axis=1)Drop multiple columns by name
df.dropna(axis=1, how='any')Drop columns with NaN values
df.drop(0)Drop rows by index - 0
df.drop([0, 2, 4])drop multiple rows
df[(df['col1'] > 0) & (df['col2'] != 'open')]drop rows by condition
df.reset_index()drop index
Pandas cheat sheet: data cleaning
Data cleaning steps
Below you can find the data cleaning steps in order to ensure that your dataset is good for decisions:
- Are there obvious errors
- mixed data
- data without structured - different column lengths
- Is data consistent
- same units - km, m, etc
- same way - Paris, Par
- same data types - '0.1', 0,1
- Missing values
- how many
- reasons for missing values
- Same format
- DD/MM/YYYY, YY-MM-DD
- '15 M', '15:00'
- Duplicates
- duplicates in rows and values
- drop duplicates
- dedupe - keep only one - Par / Paris / Paris (Fra)
- Outliers
- detect and remove outliers
- Data bias
- is data biased
- does it represent the whole population or part of it
- how data was selected
- Data noise
- unwanted data items and values
- invalid data
- Data leakage
- use information from outside of the training model
Note: Please add ideas and suggestions in the comments below. Thanks you 💕