


Need to get value_counts for multiple columns in Pandas DataFrame? In this article we will cover several options to get value counts for multiple columns or the whole DatFrame.
Setup
Let's create a sample DataFrame which will be used in the next examples:
import numpy as np
import pandas as pd

df = pd.DataFrame(np.random.randint(0, 2, (5, 3)), columns=list('ABC'))
The tabular representation of the DataFrame is:
| A | B | C | |
|---|---|---|---|
| 0 | 1 | 0 | 1 |
| 1 | 0 | 1 | 1 |
| 2 | 0 | 1 | 1 |
| 3 | 0 | 0 | 1 |
| 4 | 0 | 1 | 1 |
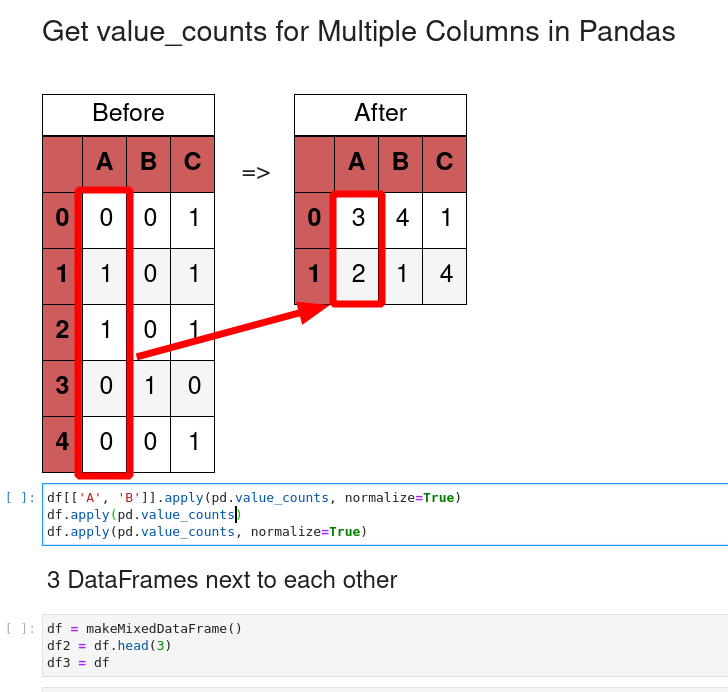
Step 1: Apply value_counts on several columns
Let's start with applying the function value_counts() on several columns. This can be done by using the function apply().
We can list the columns of our interest:
df[['A', 'B']].apply(pd.value_counts)
The results is a DataFrame with the count for columns:
| A | B | |
|---|---|---|
| 0 | 4 | 2 |
| 1 | 1 | 3 |
Step 2: Apply value_counts with parameters
What if we like to use value_counts() on multiple columns with parameters? Then we can pass them the the apply() function as:
df[['A', 'B']].apply(pd.value_counts, normalize=True)
The result is the normalized count of columns A and B:
| A | B | |
|---|---|---|
| 0 | 0.8 | 0.4 |
| 1 | 0.2 | 0.6 |
Step 3: Apply value_counts on all columns
To apply value_counts() on every column in a DataFrame we can use the same syntax as before:
df.apply(pd.value_counts)
The result is the count of each column:
| A | B | C | |
|---|---|---|---|
| 0 | 4 | 2 | NaN |
| 1 | 1 | 3 | 5.0 |
Step 4: Simulate value_counts with melt
Finally let's check how we can use advanced analytics in order to manipulate data.
We will use the melt() function in order to reshape the original DataFrame and get count for columns.
The first step is to use melt():
df.melt(var_name='column', value_name='value')
This will change data into two columns - in other words - DataFrame will be represented row wise in columns:
- column - the source column
- value - the value of the column
| column | value | |
|---|---|---|
| 0 | A | 1 |
| 1 | A | 0 |
| 2 | A | 0 |
| 3 | A | 0 |
| 4 | A | 0 |
Now we can apply value_counts():
df.melt(var_name='column', value_name='value').value_counts()
To get result as:
column  value
C       1        5
A       0        4
B       1        3
        0        2
A       1        1
dtype: int64
or we can display the results as a DataFrame with sorted counts:
(pd.DataFrame(
    df.melt(var_name='column', value_name='value').value_counts())
.sort_values(by=['column']).rename(columns={0: 'count'}))
| count | ||
|---|---|---|
| column | value | |
| A | 0 | 4 |
| 1 | 1 | |
| B | 1 | 3 |
| 0 | 2 | |
| C | 1 | 5 |
Advanced users can go further and combine:
pd.crosstab()and
df.melt
pd.crosstab(**df.melt(var_name='columns', value_name='index'))
This will result into:
| columns | A | B | C |
|---|---|---|---|
| index | |||
| 0 | 4 | 2 | 0 |
| 1 | 1 | 3 | 5 |
Conclusion
To summarize we saw how to apply value_counts() on multiple columns. We covered how to use value_counts() with parameters and for every column in DataFrame.
Finally we discussed advanced data analytics techniques to get count of value for multiple columns.