


In this post, we will see how to count distinct values in Pandas.
The SQL's Equivalent of count(distinct) is method nunique(). It will count distinct values per group in Pandas DataFrame:
(1) Pandas method nunique() and `groupby()
df.groupby('Magnitude Type')['Date'].nunique()
(2) Pandas count distinct - nunique() + agg()
df.groupby(['Magnitude Type'])['Date'].agg(['count', 'nunique'])
The above solution will group by column 'Magnitude Type' and will count all unique values for column 'Date'.
If you need to learn more about Pandas and SQL you can visit this cheat sheet: Pandas vs SQL Cheat Sheet.
Let's cover the above in more detail. Suppose we have DataFrame like:
| Date | Latitude | Longitude | Depth | Magnitude Type |
|---|---|---|---|---|
| 01/02/1965 | 19.246 | 145.616 | 131.6 | MW |
| 01/04/1965 | 1.863 | 127.352 | 80.0 | MW |
| 01/05/1965 | -20.579 | -173.972 | 20.0 | MW |
| 01/08/1965 | -59.076 | -23.557 | 15.0 | MW |
| 01/09/1965 | 11.938 | 126.427 | 15.0 | MW |
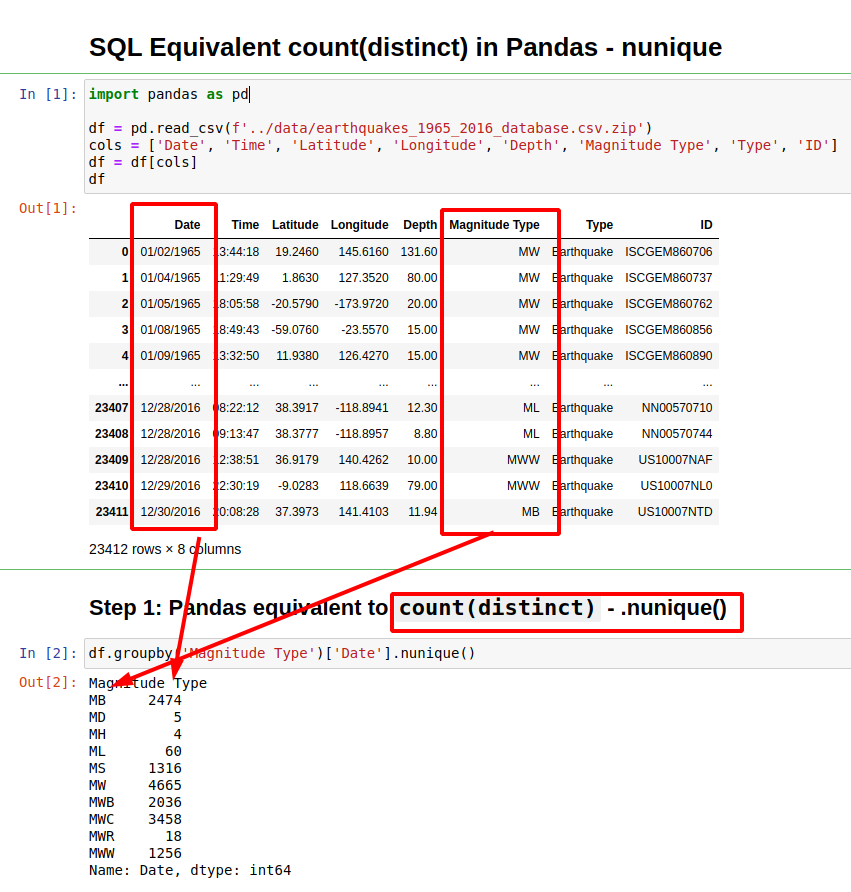
Step 1: nunique() and groupby() - SQL's equivalent to count(distinct) in Pandas
If we like to group by a column and then get unique values for another column in Pandas you can use the method: .nunique().
The syntax is simple:
df.groupby('Magnitude Type')['Date'].nunique()
the result is similar to the SQL query:
SELECT count(distinct Date) FROM earthquakes GROUP BY `Magnitude Type`;
Magnitude Type
MB     2474
MD        5
MH        4
ML       60
MS     1316
MW     4665
MWB    2036
MWC    3458
MWR      18
MWW    1256
Name: Date, dtype: int64
Method value_counts will return the total values and not the unique ones.
df['Magnitude Type'].value_counts(dropna=False)
result:
MW     7722
MWC    5669
MB     3761
MWB    2458
MWW    1983
MS     1702
ML       77
MWR      26
MD        6
MH        5
NaN       3
Name: Magnitude Type, dtype: int64
Be careful for NaN values. They can make difference in the numbers.
Step 2: nunique() and agg() in Pandas
If we like to get all unique values in each group plus information like:
minmaxcountmean
You can modify the upper query a bit:
df.groupby(['Magnitude Type'])['Date'].agg(['count', 'nunique'])
This will result into:
| count | nunique | min | |
|---|---|---|---|
| Magnitude Type | |||
| MB | 3761 | 2474 | 01/01/1975 |
| MD | 6 | 5 | 02/28/2001 |
| MH | 5 | 4 | 02/09/1971 |
| ML | 77 | 60 | 01/03/1976 |
| MS | 1702 | 1316 | 01/01/1973 |
| MW | 7722 | 4665 | 01/01/1967 |
| MWB | 2458 | 2036 | 01/01/1995 |
| MWC | 5669 | 3458 | 01/01/1997 |
| MWR | 26 | 18 | 02/13/2012 |
| MWW | 1983 | 1256 | 01/01/2011 |
As you can see for Magnitude Type = MH there are 4 unique Dates but 5 records:
| Date | Latitude | Longitude | Depth | Magnitude Type | |
|---|---|---|---|---|---|
| 1848 | 02/09/1971 | 34.416000 | -118.370000 | 6.000 | MH |
| 1849 | 02/09/1971 | 34.416000 | -118.370000 | 6.000 | MH |
| 9664 | 10/18/1989 | 37.036167 | -121.879833 | 17.214 | MH |
| 10584 | 08/17/1991 | 41.679000 | -125.856000 | 1.303 | MH |
| 10869 | 04/25/1992 | 40.335333 | -124.228667 | 9.856 | MH |
Because there are 2 records for date: 02/09/1971.
Step 3: Pandas count distinct multiple columns
To count number of unique values for multiple columns in Pandas there are two options:
- Combine
agg()+nunique() - Pandas method
crosstab()
Count distinct with agg() + nunique()
First one is using the same approach as above:
df.groupby('Magnitude Type').agg({'Date': ['nunique', 'count'],
                                      'Depth': ['nunique', 'count']})
result:
| Date | Depth | |||
|---|---|---|---|---|
| nunique | count | nunique | count | |
| Magnitude Type | ||||
| MB | 2474 | 3761 | 911 | 3761 |
| MD | 5 | 6 | 6 | 6 |
| MH | 4 | 5 | 4 | 5 |
| ML | 60 | 77 | 67 | 77 |
| MS | 1316 | 1702 | 206 | 1702 |
Count distinct in Pandas with crosstab()
Usually Pandas provide multiple ways of achieving something. In this example we are going to use the method crosstab.
It might be slower than the other but you may have additional useful information for more insights.
So first let's do a simple demo of crosstab:
pd.crosstab(df['Magnitude Type'], df['Date'])
This will give a table which is showing information for each Date and Magnitude Type:
| Date | 01/01/1967 | 01/01/1969 | 01/01/1970 | 01/01/1971 | 01/01/1972 |
|---|---|---|---|---|---|
| Magnitude Type | |||||
| MW | 2 | 1 | 1 | 1 | 1 |
| MWB | 0 | 0 | 0 | 0 | 0 |
| MWC | 0 | 0 | 0 | 0 | 0 |
| MWR | 0 | 0 | 0 | 0 | 0 |
| MWW | 0 | 0 | 0 | 0 | 0 |
And then we can summarize the information into unique values by using .ne(0).sum(1) :
pd.crosstab(df['Magnitude Type'], df['Date']).ne(0).sum(1)
result:
Magnitude Type
MB     2474
MD        5
MH        4
ML       60
MS     1316
MW     4665
MWB    2036
MWC    3458
MWR      18
MWW    1256
dtype: int64
Method ne(0) will convert anything different from 0 to True and 0 to False. Then we are going to sum across rows.
Step 4: Count distinct with condition in Pandas
Finally we have an option of using a lambda in order to count the unique values with condition.
This will be useful if you like to apply conditions on the count - for example excluding some records.
df.groupby('Magnitude Type')['Date'].apply(lambda x: x.unique().shape[0])
For example example excluding groups smaller than 1000:
df.groupby('Magnitude Type')['Date'].apply(lambda x: x.unique().shape[0] if x.unique().shape[0] > 1000 else None).dropna()