


In this article, we'll talk about how to reshape Pandas Series into 2d array. The example is inspired by getting data from a web/HTML table. Copying a web table might come as a single column instead of a table.
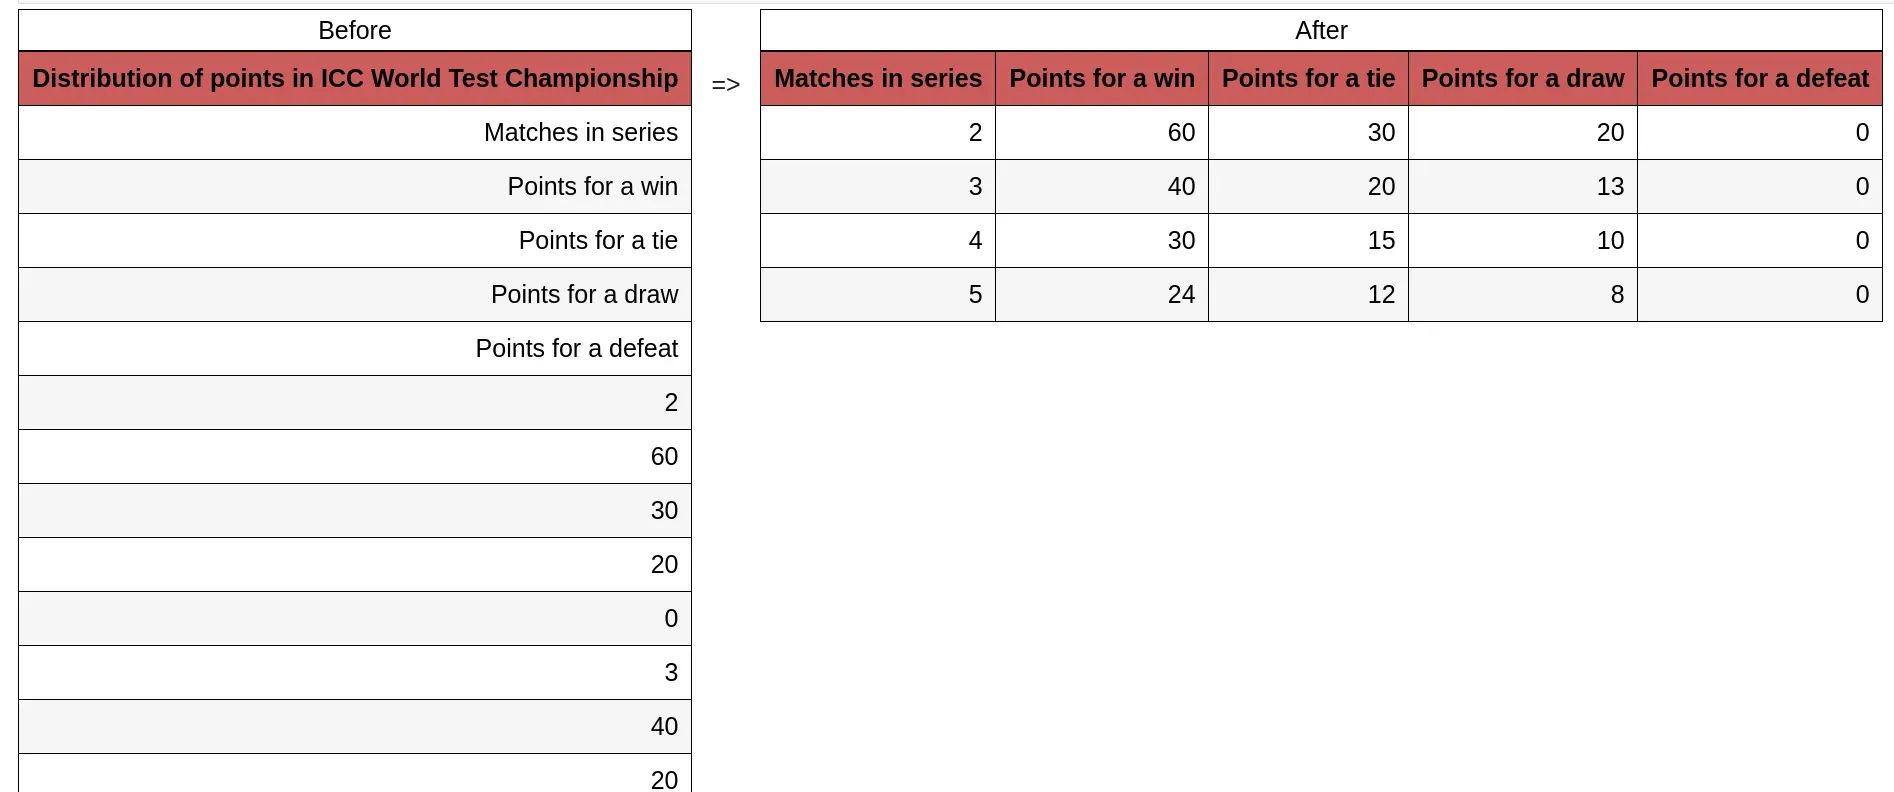
Suppose you need to copy paste next table:
|
|
||||
|
Matches in series |
Points for a win |
Points for a tie |
Points for a draw |
Points for a defeat |
|
2 |
60 |
30 |
20 |
0 |
|
3 |
40 |
20 |
13 |
0 |
|
4 |
30 |
15 |
10 |
0 |
|
5 |
24 |
12 |
8 |
0 |
Instead of getting a nice table you will end with a single column in form of:
Matches in series


Points for a win


Points for a tie
Step 1: Get the data as a single column DataFrame
Method 1
The first step is to copy paste the table data into a new CSV file and save it as csv - data.csv. Then read it by:
import pandas as pd
df = pd.read_csv('~/Desktop/data.csv')
The second way is by reading the table from web address:
import pandas as pd
df = pd.read_html('https://blog.softhints.com/how-to-merge-multiple-csv-files-with-python/')
The final DataFrame should look like:
| Distribution of points in ICC World Test Championship | |
|---|---|
| 0 | Matches in series |
| 1 | Points for a win |
| 2 | Points for a tie |
| 3 | Points for a draw |
| 4 | Points for a defeat |
Step 2: Find the shape for the initial table
In this step we need to find what is the shape which should be used for reshaping. In case of incorrect shape error is raised:
ValueError: cannot reshape array of size 25 into shape (4)
In order to do this we need to do two steps:
-
Check the original table - it has 5 columns
- then we can get the names
-
Check the DataFrame data by:
df.shape
To get if there is
(25, 1)
The number is divisible to 5 which is the expected. If this is not the case we have extra data - empty lines, formatting which needs to be cleaned.
Step 3: Reshape Series - convert single column to multiple columns
To reshape Series to a DataFrame which has the same table form as the original source:
pd.DataFrame(df.iloc[5:, :].values.reshape(-1, 5),
                   columns=df.iloc[:5, 0].values)
Which give us result of:
| Matches in series | Points for a win | Points for a tie | Points for a draw | Points for a defeat | |
|---|---|---|---|---|---|
| 0 | 2 | 60 | 30 | 20 | 0 |
| 1 | 3 | 40 | 20 | 13 | 0 |
| 2 | 4 | 30 | 15 | 10 | 0 |
| 3 | 5 | 24 | 12 | 8 | 0 |
Let's explain how reshaping is working:
df.iloc[5:, :]- we read all values except the first 5. Since they are the table header we don't need them..reshape(-1, 5)- next we change the shape of the values ( from previous piece of code (20, 1) to (-1, 5). This means making 5 columns and the required number of rows. You can explicitly write number of rows as - (4, 5)columns=df.iloc[:5, 0].values- as you already guess - get the header values and set them as column names