In this quick guide, we'll show how to plot time series as work timetable in Pandas. The process includes several steps in order to prepare the data.
First let's start with generating time series data for the work timetable.
Generating range of time series between 2 dates with frequency of 30 minutes:
periods = pd.date_range(start='1/1/2021', end='1/5/2021', freq='30min')
df = pd.DataFrame({'start_time':periods[:-1]})
Note: the [:-1] is excluding the single period generated for the last date.
Next we are going to generate column - availability - which will be two options:
- 0: 'UNAVAILABLE'
- 1:'AVAILABLE'
import numpy as np
df['availability'] = np.random.randint(0, 2, df.shape[0])
df['availability'] = df['availability'].map({0: 'UNAVAILABLE', 1:'AVAILABLE'})
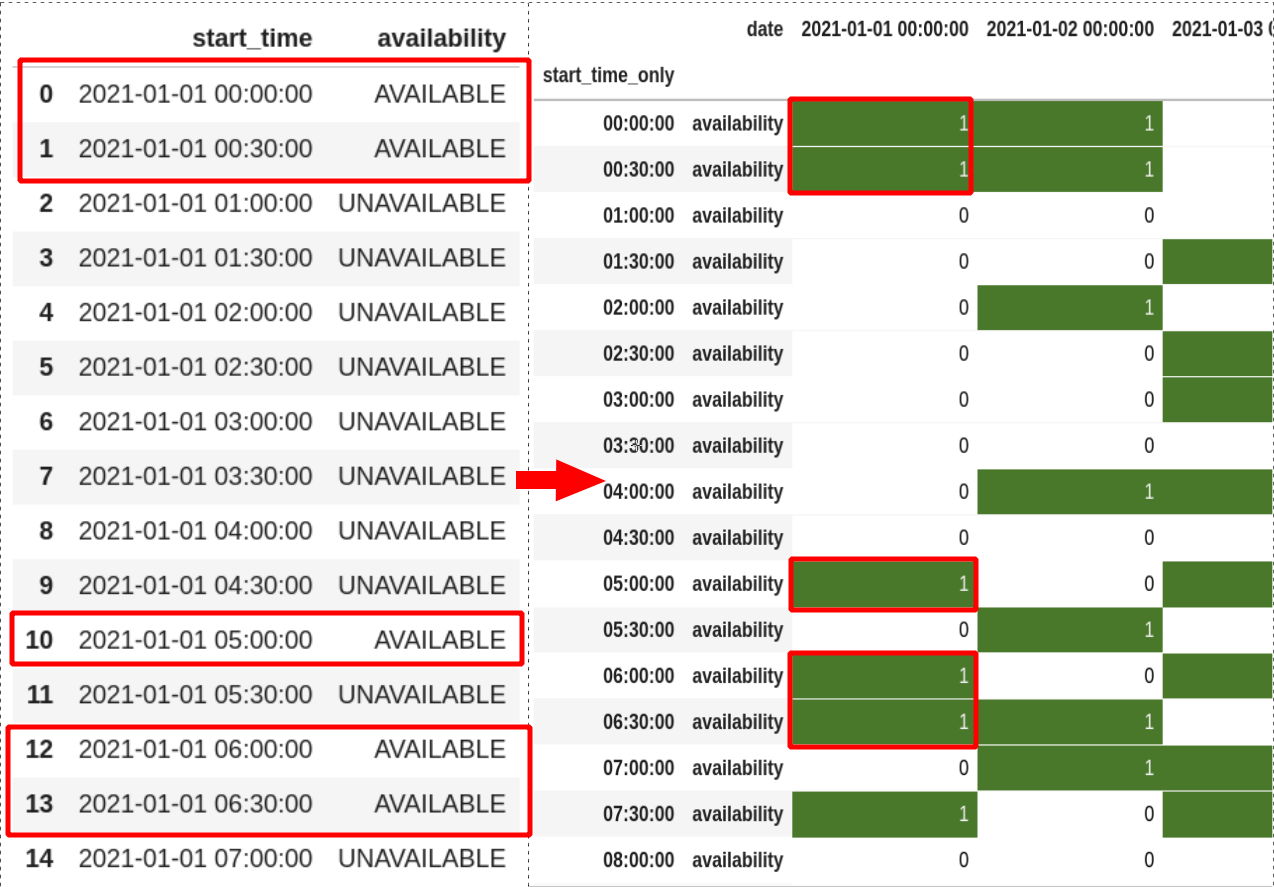
The picture below shows the initial data and the final output:
Step 1: Split Datetime column into date and time columns
To start we need to prepare our datetime column. First we will ensure that it's really a datetime column.
Next we will split the start_time into two parts:
- date
- time
This will help us to plot the timetable:
df['start_time'] = pd.to_datetime(df['start_time'])
df['date'] = df['start_time'].dt.date
df['start_time_only'] = df['start_time'].dt.time
Step 2: Map string values to numbers
Depending on your data you may need to remap the values. If so, you can use a dictionary where the key is the old value. The new one is the value in the dictionary:
df['availability'] = df['availability'].map({'UNAVAILABLE': 0, 'AVAILABLE': 1})
Step 3: Convert time series to Work Timetable
Finally we are going to generate the timetable itself by:
df[['availability', 'date','start_time_only']].set_index(['date','start_time_only']).unstack().swaplevel(0, 1, axis = 1).sort_index(axis = 1).T.style.background_gradient(cmap='ocean_r')
Let's add some explanation to the code above:
- we select only few columns from the DataFrame (in case of many)
- set new index by
.set_index(['date','start_time_only'])- so basically we leave only 1 column -availability .unstack()will pivot the hierarchical index labels.swaplevel(0, 1, axis = 1).sort_index(axis = 1).T- is optional. This will swap the levels, sort the index(if needed) and finally will transpose the rows to columns.style.background_gradient(cmap='ocean_r')- finally we are going to add style in order to highlight the options
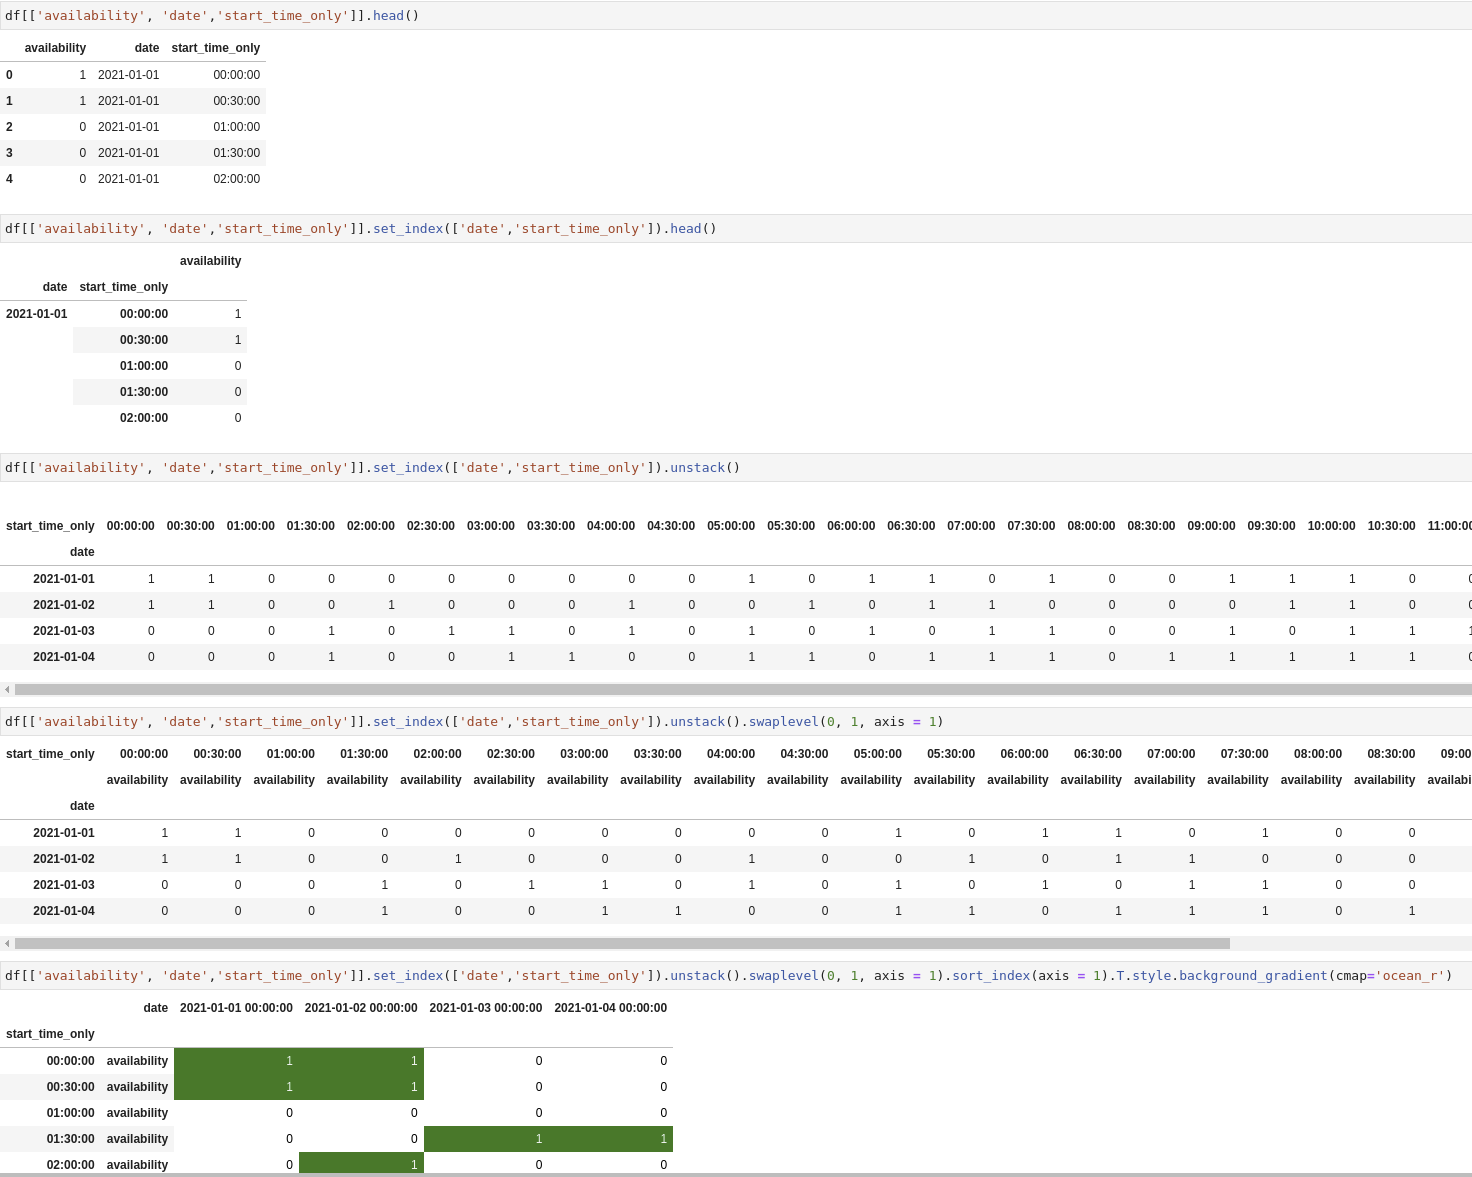
On the picture below you can follow the steps:
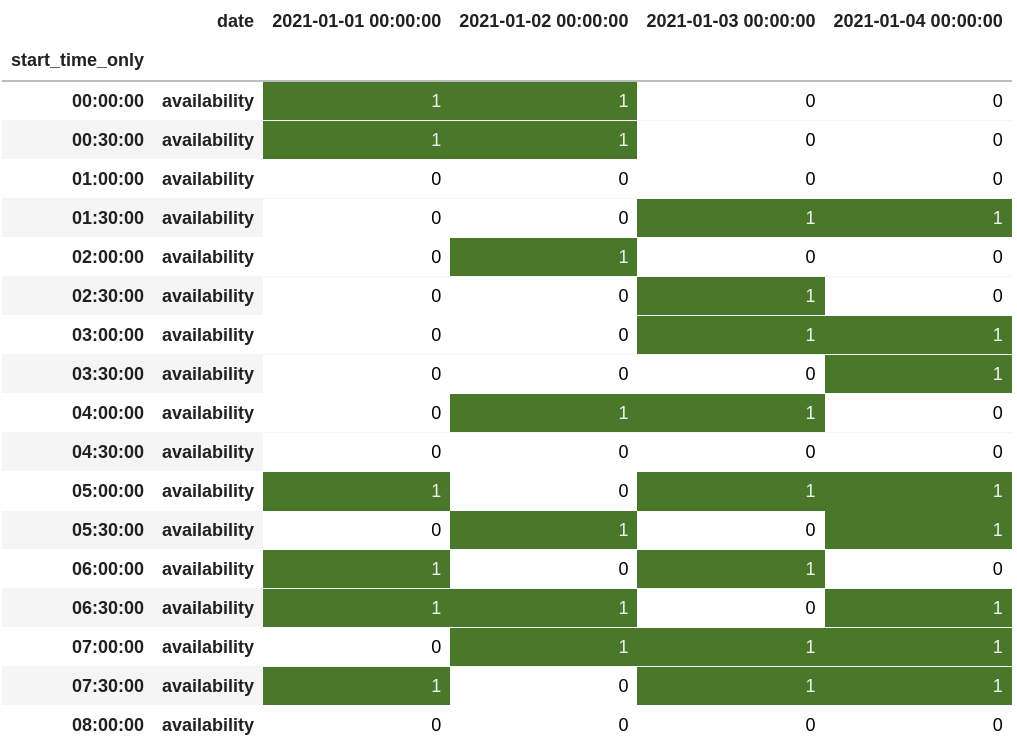
Below you can find the final timetable: