Need to plot latitude and longitude from Pandas DataFrame in Python?
If so, you may use the following libraries to do so:
geopandasshapelymatplotlib- optional - if the map is not displayedplotly- alternative solution
Below you can find working example and all the steps in order to convert pairs of latitude and longitude to a world map.
Step 1: Install required libraries - geopandas
In order to use the code below you need the latest Python. You need to install several libraries with:
pip install geopandas
pip install Shapely
pip install matplotlib
The matplotlib library is needed for Jupyter Notebook if the plot is not shown.
It's a good idea to update all libraries to the latest versions.
Step 2: Create DataFrame with geocoding data
For this example we are going to use data from Significant Earthquakes, 1965-2016.
You can download it from Kaggle or read it with Python - How to Search and Download Kaggle Dataset to Pandas DataFrame
You can find the data below:
import pandas as pd

df = pd.read_csv(f'../data/earthquakes_1965_2016_database.csv.zip')
df
data:
| Date | Latitude | Longitude | Depth | Type |
|---|---|---|---|---|
| 01/02/1965 | 19.246 | 145.616 | 131.6 | Earthquake |
| 01/04/1965 | 1.863 | 127.352 | 80.0 | Earthquake |
| 01/05/1965 | -20.579 | -173.972 | 20.0 | Earthquake |
| 01/08/1965 | -59.076 | -23.557 | 15.0 | Earthquake |
| 01/09/1965 | 11.938 | 126.427 | 15.0 | Earthquake |
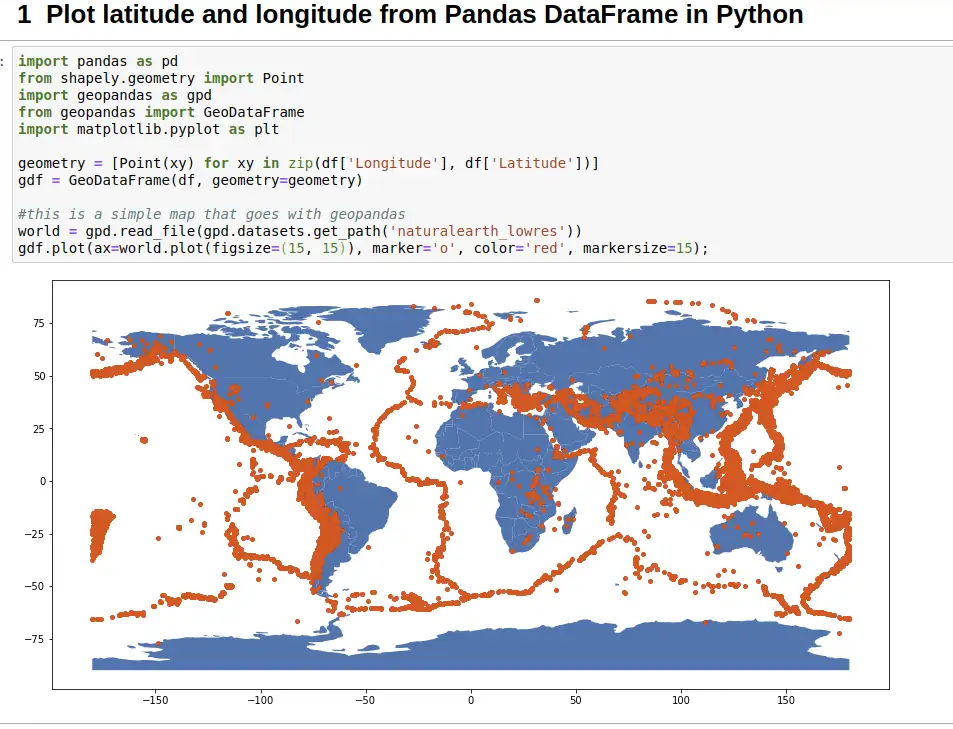
Step 3: Plot latitude and longitude to world map
Finally we are going to plot the pairs latitude and longitude on the world map. The points will be paint in red color while to earth will be blue:
world = gpd.read_file(gpd.datasets.get_path('naturalearth_lowres'))
gdf.plot(ax=world.plot(figsize=(15, 15)), marker='o', color='red', markersize=15);
The result is:
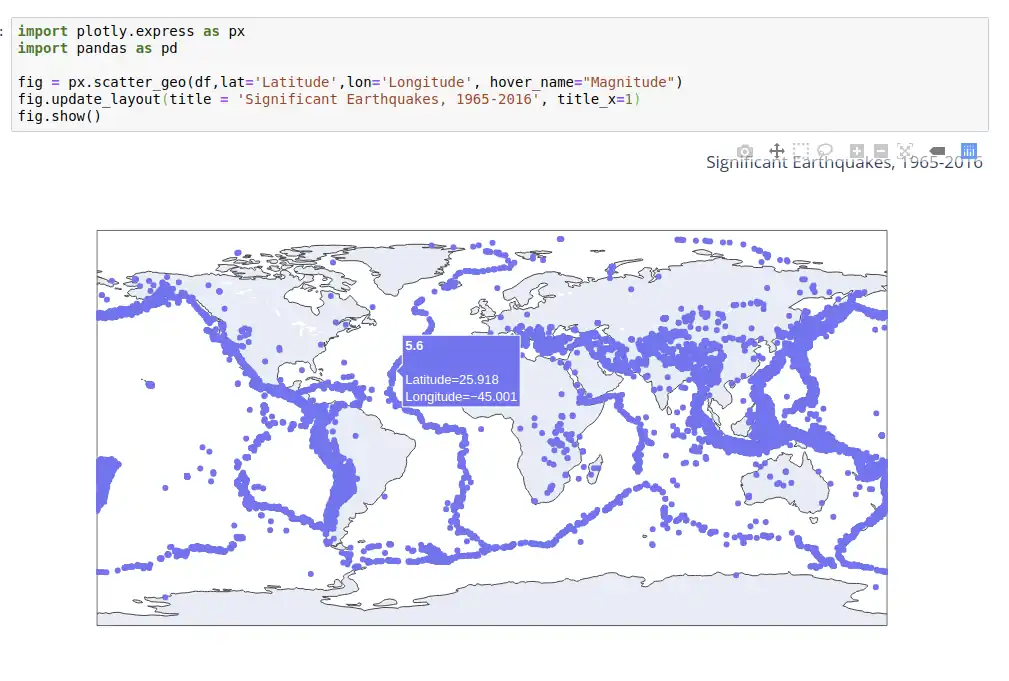
Step 4: Plot latitude and longitude to interactive map plus hover with plotly
As an alternative solution you can use library plotly to draw a map from latitude and longitude.
You can find the code for it below:
import plotly.express as px
import pandas as pd

fig = px.scatter_geo(df,lat='Latitude',lon='Longitude', hover_name="Magnitude")
fig.update_layout(title = 'Significant Earthquakes, 1965-2016', title_x=0.5)
fig.show()
The advantage of these method is that plots an interactive map which alows you to hover on the points.
You can also display important information plus coordinates like:
- name
- latitude
- longitude
or zoom in/out: