


In this quick tutorial, we're going to discuss stratified sampling in Pandas and Python.
The following syntax can be used to sample stratified in Pandas:
(1) stratified sampling - disproportionated
(df
	.groupby('continent', group_keys=False)
	.apply(lambda x: x.sample(2))
)
(2) stratified sampling - proportional
(df
	.groupby('continent', group_keys=False)
	.apply(lambda x: x.sample(frac=0.1))
)
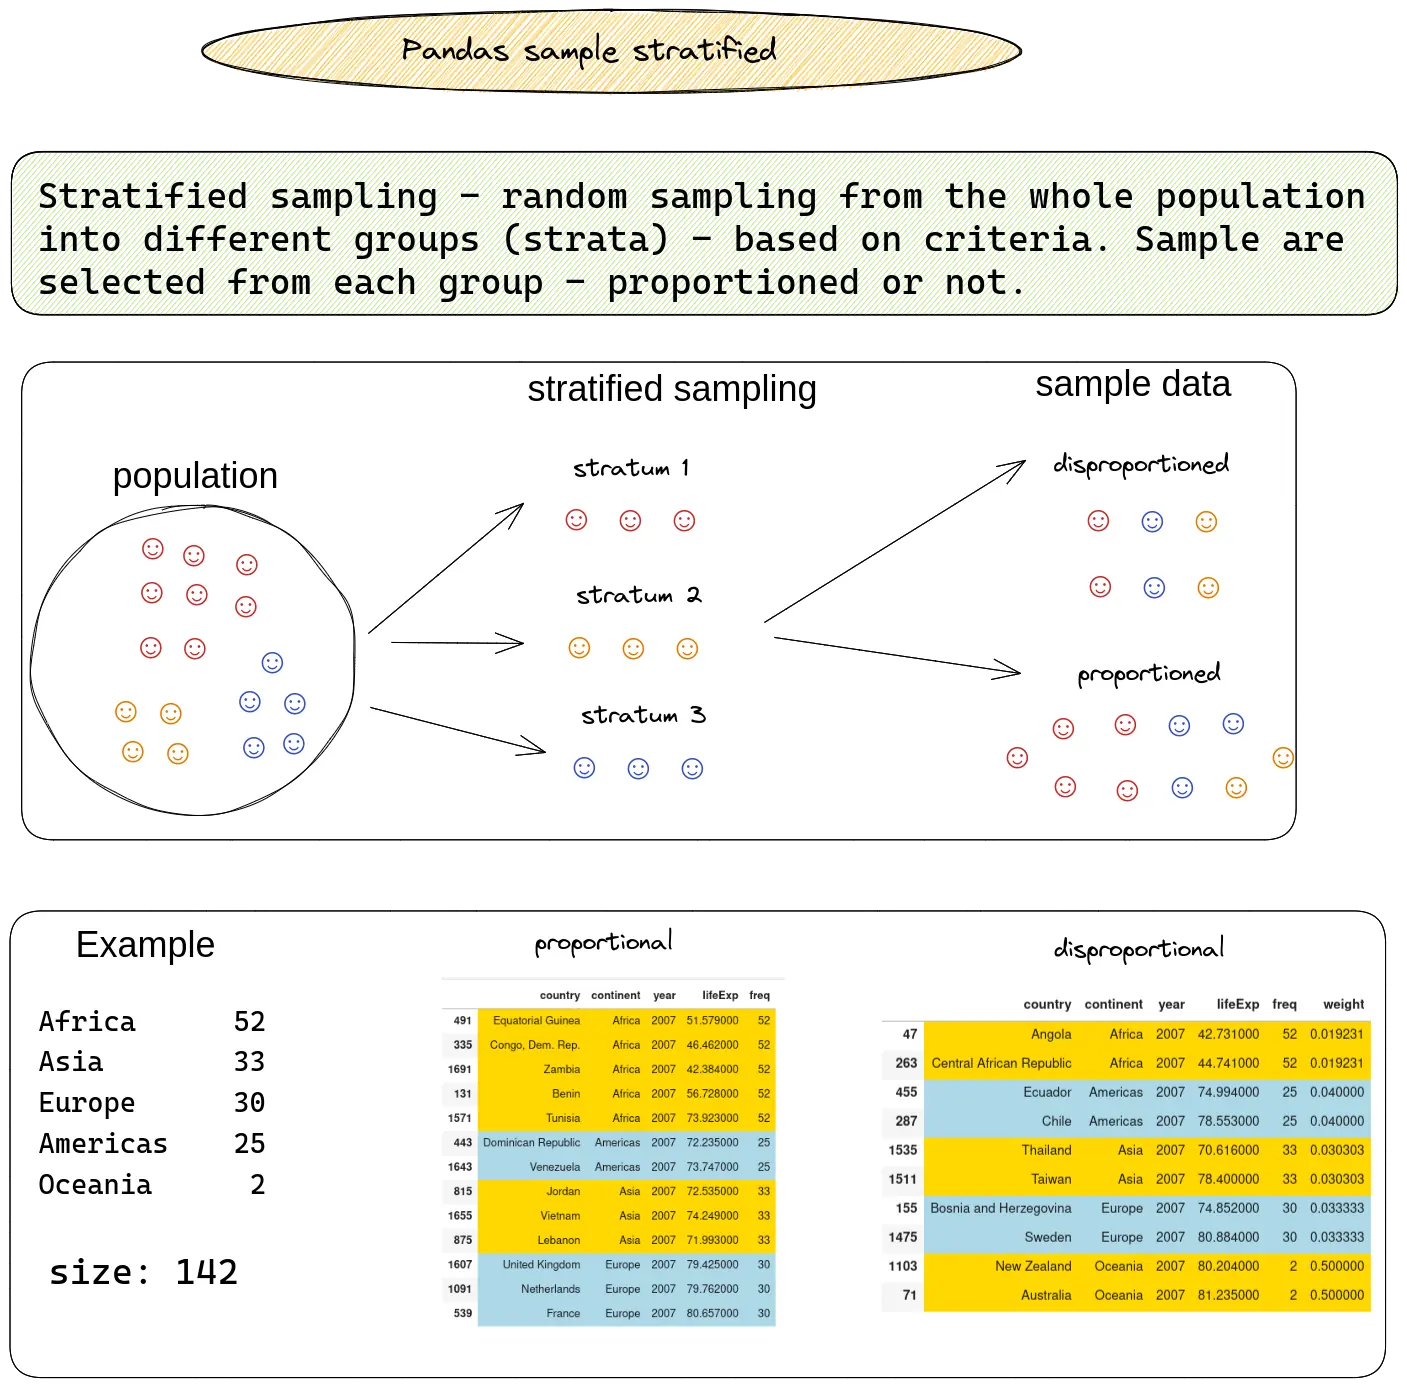
The image below illustrates the technique called stratified sampling:
Next, you'll see the steps to do stratified sampling in practice.
Setup
First, let's create a sample DataFrame:
import plotly.express as px
df = px.data.gapminder().query("year == 2007")
cols = df.columns[:4]
df = df[cols]
data has the following shape:
(142, 5)
First rows of this DataFrame
| country | continent | year | lifeExp | freq | |
|---|---|---|---|---|---|
| 11 | Afghanistan | Asia | 2007 | 43.828 | 33 |
| 23 | Albania | Europe | 2007 | 76.423 | 30 |
| 35 | Algeria | Africa | 2007 | 72.301 | 52 |
| 47 | Angola | Africa | 2007 | 42.731 | 52 |
| 59 | Argentina | Americas | 2007 | 75.320 | 25 |
Separate population into strata
The whole population of this dataset is 142 countries.
Below you can find the proportions per each stratum:
df[col_name].value_counts()
result is:
Africa  	52
Asia    	33
Europe  	30
Americas	25
Oceania  	2
Name: continent, dtype: int64
Find the sample size
Next we need to decide on what should be the size of the sample. There are different strategies on this.
These are the options available in Pandas sample() method:
n- number of items to return. We get N random itemsfrac- fraction of items to returnweights- probability weighting
So we can select the size of:
- total sample as percentage on the whole population
- each group
- disproportionated
- proportionated
Disproportional stratified sampling
In this approach the size of each sample group is not proportional to the entire population.
We will get equal number of items for each group:
(df
	.groupby('continent', group_keys=False)
	.apply(lambda x: x.sample(2))
)
The result is 2 sized stratum - no matter the size of each group:
| country | continent | year | lifeExp | freq | |
|---|---|---|---|---|---|
| 911 | Libya | Africa | 2007 | 73.952 | 52 |
| 899 | Liberia | Africa | 2007 | 45.678 | 52 |
| 443 | Dominican Republic | Americas | 2007 | 72.235 | 25 |
| 791 | Jamaica | Americas | 2007 | 72.567 | 25 |
| 1679 | Yemen, Rep. | Asia | 2007 | 62.698 | 33 |
| 1319 | Saudi Arabia | Asia | 2007 | 72.777 | 33 |
| 779 | Italy | Europe | 2007 | 80.546 | 30 |
| 1607 | United Kingdom | Europe | 2007 | 79.425 | 30 |
| 1103 | New Zealand | Oceania | 2007 | 80.204 | 2 |
| 71 | Australia | Oceania | 2007 | 81.235 | 2 |
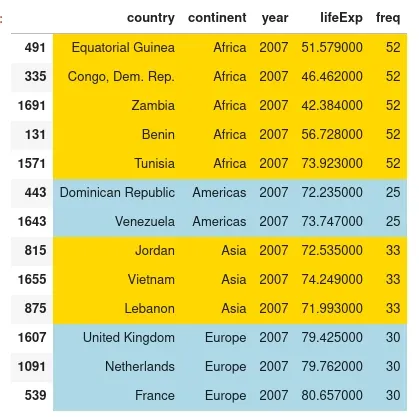
Proportional stratified sampling
Taking random sampling from stratified groups which is proportional to the population.
We can do proportional stratified sampling in Pandas by sampling with parameter x.sample(frac=0.1):
(df
	.groupby('continent', group_keys=False)
	.apply(lambda x: x.sample(frac=0.1))
)
This will give us countries proportioned to the initial population:
| country | continent | year | lifeExp | freq | |
|---|---|---|---|---|---|
| 491 | Equatorial Guinea | Africa | 2007 | 51.579 | 52 |
| 335 | Congo, Dem. Rep. | Africa | 2007 | 46.462 | 52 |
| 1691 | Zambia | Africa | 2007 | 42.384 | 52 |
| 131 | Benin | Africa | 2007 | 56.728 | 52 |
| 1571 | Tunisia | Africa | 2007 | 73.923 | 52 |
| 443 | Dominican Republic | Americas | 2007 | 72.235 | 25 |
| 1643 | Venezuela | Americas | 2007 | 73.747 | 25 |
| 815 | Jordan | Asia | 2007 | 72.535 | 33 |
| 1655 | Vietnam | Asia | 2007 | 74.249 | 33 |
| 875 | Lebanon | Asia | 2007 | 71.993 | 33 |
| 1607 | United Kingdom | Europe | 2007 | 79.425 | 30 |
| 1091 | Netherlands | Europe | 2007 | 79.762 | 30 |
| 539 | France | Europe | 2007 | 80.657 | 30 |
Africa is the most represented continent while Oceania is missing from this sample.
color row based on column value
If you like to learn how to style each group into different color check: color Pandas DataFrame based on value
def format_color_groups(df):
	colors = ['gold', 'lightblue']
	x = df.copy()
	factors = list(x['continent'].unique())
	i = 0
	for factor in factors:
    	style = f'background-color: {colors[i]}'
    	x.loc[x['continent'] == factor, :] = style
    	i = not i
	return x

d1.style.apply(format_color_groups, axis=None)
The result is:
group by sample weights in Pandas
We can use weights to get proportional sampling. First we need to calculate the weights of each stratum:
Calc weights - groupby + .transform('count')
df['weight'] = (df
 	.groupby('continent')
 	.country
 	.transform('count')
)
as a result we have Pandas series which contains the weight for each row:
11  	33
23  	30
35  	52
47  	52
59  	25
    	..
1655	33
1667	33
1679	33
1691	52
1703	52
Name: country, Length: 142, dtype: int64
Calc weights - equal representation
To get equal representation of each group we can calculate the weights:
df['weight'] = 1./(df
 	.groupby('continent')
 	.country
 	.transform('count')
)
The get disproportional rate:
11  	0.030303
23  	0.033333
35  	0.019231
47  	0.019231
59  	0.040000
      	...
1655	0.030303
1667	0.030303
1679	0.030303
1691	0.019231
1703	0.019231
Name: weight, Length: 142, dtype: float64
Calc weights - map and value_counts
We can achieve the same result by .map and .value_counts()
df['weight'] = (df
 	.continent
 	.map(df['continent'].value_counts())
)
sampling with weights
To do sampling with respect to distribution of a value in a given column we can use the calculate frequency for parameter weights:
df.sample(n=10, weights = df['weight'])
Result is weighted sampling:
| country | continent | year | lifeExp | freq | weight | |
|---|---|---|---|---|---|---|
| 851 | Korea, Rep. | Asia | 2007 | 78.623 | 33 | 33 |
| 491 | Equatorial Guinea | Africa | 2007 | 51.579 | 52 | 52 |
| 1043 | Mozambique | Africa | 2007 | 42.082 | 52 | 52 |
| 1175 | Pakistan | Asia | 2007 | 65.483 | 33 | 33 |
| 1223 | Philippines | Asia | 2007 | 71.688 | 33 | 33 |
| 1667 | West Bank and Gaza | Asia | 2007 | 73.422 | 33 | 33 |
| 1031 | Morocco | Africa | 2007 | 71.164 | 52 | 52 |
| 1139 | Nigeria | Africa | 2007 | 46.859 | 52 | 52 |
| 1559 | Trinidad and Tobago | Americas | 2007 | 69.819 | 25 | 25 |
| 635 | Guinea-Bissau | Africa | 2007 | 46.388 | 52 | 52 |
Conclusion
In this article, we took a closer look at stratified sampling in Pandas and how to apply it in practice. We covered the two main approaches in stratified sampling - disproportionated and proportionated.
Finally we explain how to use weights to sample and groupby in Pandas DataFrame.